
MATLAB: An Introduction with Applications
6th Edition
ISBN: 9781119256830
Author: Amos Gilat
Publisher: John Wiley & Sons Inc
expand_more
expand_more
format_list_bulleted
Related questions
Topic Video
Question
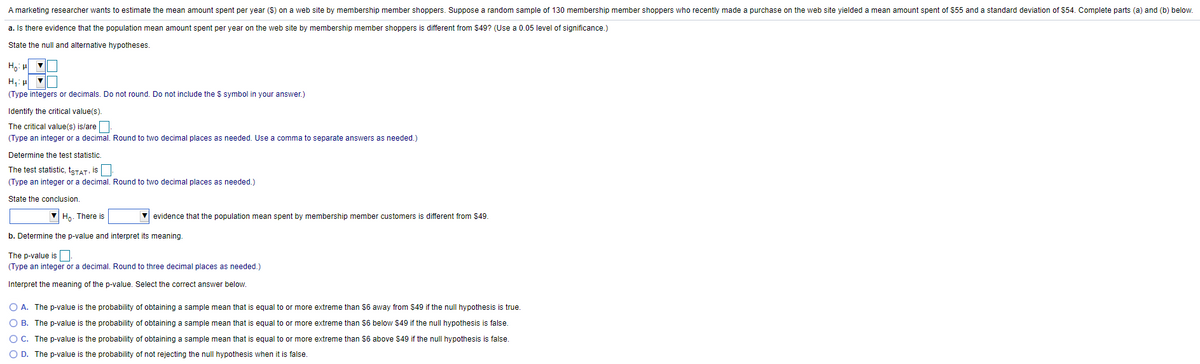

Transcribed Image Text:A marketing researcher wants to estimate the mean amount spent per year ($) on a web site by membership member shoppers. Suppose a random sample of 130 membership member shoppers who recently made a purchase on the web site yielded a mean amount spent of $55 and a standard deviation of $54. Complete parts (a) and (b) below.
a. Is there evidence that the population mean amount spent per year on the web site by membership member shoppers is different from $49? (Use a 0.05 level of significance.)
State the null and alternative hypotheses.
H,:
(Type integers or decimals. Do not round. Do not include the $ symbol in your answer.)
Identify the critical value(s).
The critical value(s) is/are
(Type an integer or a decimal. Round to two decimal places as needed. Use a comma to separate answers as needed.)
Determine the test statistic.
The test statistic, teTAT, is
(Type an integer or a decimal. Round to two decimal places as needed.)
State the conclusion.
Hn. There is
V evidence that the population mean spent by membership member customers is different from $49.
b. Determine the p-value and interpret its meaning.
The p-value is
(Type an integer or a decimal. Round to three decimal places as needed.)
Interpret the meaning of the p-value. Select the correct answer below.
O A. The p-value is the probability of obtaining a sample mean that is equal to or more extreme than $6 away from $49 if the null hypothesis is true.
O B. The p-value is the probability of obtaining a sample mean that is equal to or more extreme than $6 below $49 if the null hypothesis is false.
O C. The p-value is the probability of obtaining a sample mean that is equal to or more extreme than $6 above $49 if the null hypothesis is false.
O D. The p-value is the probability of not rejecting the null hypothesis when it is false.
Expert Solution
This question has been solved!
Explore an expertly crafted, step-by-step solution for a thorough understanding of key concepts.

This is a popular solution

Trending nowThis is a popular solution!

Step by stepSolved in 2 steps with 1 images

Knowledge Booster


Learn more about
Need a deep-dive on the concept behind this application? Look no further. Learn more about this topic, statistics and related others by exploring similar questions and additional content below.Similar questions
- Suppose that the antenna lengths of woodlice are approximately normally distributed with a mean of 0.22 inches and a standard deviation of 0.05 inches. What proportion of woodlice have antenna lengths that are more than 0.18 inches? Round your answer to at least four decimal places.arrow_forwardSuppose that water usages in American showers are normally distributed, with an average shower using 20 gallons, and a standard deviation of 3.2 gallons. Estimate the percentage of showers that used (a) between 13.6 and 26.4 gallons. % (b) more than 26.4 gallons. % (c) less than 10.4 gallons. % (d) between 16.8 and 29.6 gallons. %arrow_forwardAccording to a recent article about individuals who have credit cards, the mean number of cards per person with credit cards is 4.5. To test this result a random survey of 60 individuals who have credit cards was conducted. The survey only includes the number of credit cards per participant. The results of the survey are attached below. (a) What is the variable of interest in this study? Is it qualitative or quantitative? (b) Do the results of the survey imply that the mean number of cards per individual is less than 4.5? Use the a = 0.05 level of significance. E Click the icon to view the data from the survey. (a) What is the variable of interest in this study? Is it qualitative or quantitative? The variable of interest is number of credit cards.It is a quantitative variable. (b) Do the results of the survey imply that the mean number of cards per individual is less than 4.5? Use the a = 0.05 level of significance. State the null and alternative hypotheses. Họ: H = 4.5 < 4.5 H1: H…arrow_forward
- A marketing researcher wants to estimate the mean amount spent per year ($) on a web site by membership member shoppers. Suppose a random sample of 100 membership member shoppers who recently made a purchase on the web site yielded a mean amount spent of $55 and a standard deviation of $52. Complete parts (a) and (b) below. a. Is there evidence that the population mean amount spent per year on the web site by membership member shoppers is different from $51? (Use a 0.01 level of significance.) State the null and alternative hypotheses. Ho: H (Type integers or decimals. Do not round. Do not include the $ symbol in your answer.) Identify the critical value(s). The critical value(s) is/are (Type an integer or a decimal. Round to two decimal places as needed. Use a comma to separate answers as needed.) Determine the test statistic. The test statistic, 1STAT, is (Type an integer or a decimal. Round to two decimal places as needed.) State the conclusion. Ho. There is evidence that the…arrow_forwardSuppose that the antenna lengths of woodlice are approximately normally distributed with a mean of 0.22 inches and a standard deviation of 0.05 inches. What proportion of woodlice have antenna lengths that are at most 0.18 inches? Round your answer to at least four decimal places.arrow_forwardSuppose that on a certain section of I-95, with a posted speed limit of 65 miles per hour, the speeds of all vehicles have a bell-shaped distribution with a mean of 72 mph and a standard deviation of 3 mph. Find the percentage of vehicles with the following speeds on this section of I-95: greater than 75 mph.arrow_forward
- A marketing researcher wants to estimate the mean amount spent per year ($) on a web site by membership member shoppers. Suppose a random sample of 100 membership member shoppers who recently made a purchase on the web site yielded a mean amount spent of $58and a standard deviation of $55.Complete parts (a) and (b) below. a. Is there evidence that the population mean amount spent per year on the web site by membership member shoppers is different from $51? (Use a 0.01 level of significance.) State the null and alternative hypotheses.arrow_forwardAccording to the American Automobile Association (AAA), the average cost of a gallon of regular unleaded fuel at gas stations in April 2007 was $2.83 (AAA Fuel Gauge Report). Assume that the standard deviation of such costs is $0.15. Suppose that a random sample of n = 100 gas stations is selected from the population and the April 2007 cost per gallon of regular unleaded fuel is determined for each. Consider , the sample mean cost per gallon. What is the approximate probability that the sample has a mean fuel cost of between $2.57 and $2.90? Please show step by step with formula.arrow_forwardFor each day of last year, the number of vehicles passing through a certain intersection was recorded by a city engineer. One objective of this study was to determine the percentage of days that more than 425 vehicles used the intersection. If the mean data was 375 vehicles per day and the standard deviation was 25 vehicles: (c) Suppose the relative frequency distribution for the data is bell-shaped, then what percentage of days between 325 and 425 vehicles used the intersection ?arrow_forward
- The distribution of the student heights at a large college is approximately bell shaped. If the mean height is 66 inches,and approximately 95% of the heights fall between 32 and 100 inches, then, the standard deviation of the heightdistribution is approximately equal toarrow_forwardAccording to the Bureau of Labor Statistics, the mean salary for registered nurses in Kentucky was $55,130. The distribution of salaries is assumed to be normally distributed with a standard deviation of $5,778. Someone would like to determine if registered nurses in Ohio have a greater average pay. To investigate this claim, a sample of 220 registered nurses is selected from the Ohio Board of Nursing, and each is asked their annual salary. The mean salary for this sample of 220 nurses is found to be $55,504.488. Completely describe the sampling distribution of the sample mean salary when samples of size 220 are selected. mean: μ x-bar = ____ standard deviation: σ x-bar = ____ shape: the distribution of is ____________(not normally distributed/normally distributed) because ___________ (the sample size is large/the sample size is not large/the population of salaries is normally distributed/the population of salaries is not normally distributed)arrow_forwardAccording to the Bureau of Labor Statistics, the mean salary for registered nurses in Kentucky was $57,688. The distribution of salaries is assumed to be normally distributed with a standard deviation of $5,879. Someone would like to determine if registered nurses in Ohio have a greater average pay. To investigate this claim, a sample of 192 registered nurses is selected from the Ohio Board of Nursing, and each is asked their annual salary. The mean salary for this sample of 192 nurses is found to be $58,016.005. 1. Completely describe the sampling distribution of the sample mean salary when samples of size 192 are selected. 2. What conjecture has been made? 3. Using the distribution described in part a, what is the probability of observing a sample mean of 58,016.005 or more? 4. Based on the probability found, what conclusion can be reached?arrow_forward
arrow_back_ios
arrow_forward_ios
Recommended textbooks for you
- MATLAB: An Introduction with ApplicationsStatisticsISBN:9781119256830Author:Amos GilatPublisher:John Wiley & Sons Inc
 Probability and Statistics for Engineering and th...StatisticsISBN:9781305251809Author:Jay L. DevorePublisher:Cengage Learning
 Statistics for The Behavioral Sciences (MindTap C...StatisticsISBN:9781305504912Author:Frederick J Gravetter, Larry B. WallnauPublisher:Cengage Learning
  Elementary Statistics: Picturing the World (7th E...StatisticsISBN:9780134683416Author:Ron Larson, Betsy FarberPublisher:PEARSON
 The Basic Practice of StatisticsStatisticsISBN:9781319042578Author:David S. Moore, William I. Notz, Michael A. FlignerPublisher:W. H. Freeman
 Introduction to the Practice of StatisticsStatisticsISBN:9781319013387Author:David S. Moore, George P. McCabe, Bruce A. CraigPublisher:W. H. Freeman
MATLAB: An Introduction with Applications
Statistics
ISBN:9781119256830
Author:Amos Gilat
Publisher:John Wiley & Sons Inc
Probability and Statistics for Engineering and th...
Statistics
ISBN:9781305251809
Author:Jay L. Devore
Publisher:Cengage Learning
Statistics for The Behavioral Sciences (MindTap C...
Statistics
ISBN:9781305504912
Author:Frederick J Gravetter, Larry B. Wallnau
Publisher:Cengage Learning
Elementary Statistics: Picturing the World (7th E...
Statistics
ISBN:9780134683416
Author:Ron Larson, Betsy Farber
Publisher:PEARSON
The Basic Practice of Statistics
Statistics
ISBN:9781319042578
Author:David S. Moore, William I. Notz, Michael A. Fligner
Publisher:W. H. Freeman
Introduction to the Practice of Statistics
Statistics
ISBN:9781319013387
Author:David S. Moore, George P. McCabe, Bruce A. Craig
Publisher:W. H. Freeman