
MATLAB: An Introduction with Applications
6th Edition
ISBN: 9781119256830
Author: Amos Gilat
Publisher: John Wiley & Sons Inc
expand_more
expand_more
format_list_bulleted
Related questions
Question
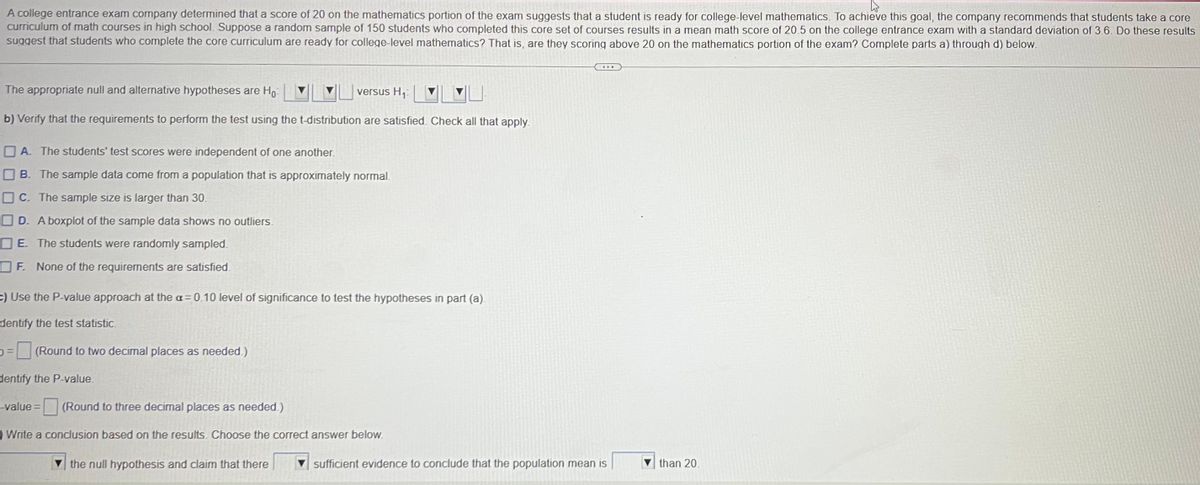

Transcribed Image Text:A college entrance exam company determined that a score of 20 on the mathematics portion of the exam suggests that a student is ready for college-level mathematics. To achieve this goal, the company recommends that students take a core
curriculum of math courses in high school. Suppose a random sample of 150 students who completed this core set of courses results in a mean math score of 20.5 on the college entrance exam with a standard deviation of 3.6. Do these results
suggest that students who complete the core curriculum are ready for college-level mathematics? That is, are they scoring above 20 on the mathematics portion of the exam? Complete parts a) through d) below.
The appropriate null and alternative hypotheses are Ho
versus H₁
b) Verify that the requirements to perform the test using the t-distribution are satisfied. Check all that apply.
A. The students' test scores were independent of one another.
B. The sample data come from a population that is approximately normal.
OC. The sample size is larger than 30.
D. A boxplot of the sample data shows no outliers.
E. The students were randomly sampled
OF. None of the requirements are satisfied.
C) Use the P-value approach at the a=0.10 level of significance to test the hypotheses in part (a).
dentify the test statistic.
=(Round to two decimal places as needed.)
dentify the P-value.
-value =
(Round to three decimal places as needed.)
) Write a conclusion based on the results. Choose the correct answer below.
the null hypothesis and claim that there
sufficient evidence to conclude that the population mean is
than 20.
Expert Solution
This question has been solved!
Explore an expertly crafted, step-by-step solution for a thorough understanding of key concepts.

This is a popular solution

Trending nowThis is a popular solution!

Step by stepSolved in 4 steps with 11 images

Knowledge Booster

Similar questions
- A college entrance exam company determined that a score of 23 on the mathematics portion of the exam suggests that a student is ready for college-level mathematics. To achieve this goal, the company recommends that students take a core curriculum of math courses in high school. Suppose a random sample of 250 students who completed this core set of courses results in a mean math score of 23.2 on the college entrance exam with a standard deviation of 3.7. Do these results suggest that students who complete the core curriculum are ready for college-level mathematics? That is, are they scoring above 23 on the mathematics portion of the exam? Complete parts a) through d) below. Click the icon to view the table of critical t-values. ... (a) State the appropriate null and alternative hypotheses. Fill in the correct answers below. The appropriate null and alternative hypotheses are H,: versus H,: (Type integers or decimals. Do not round.) (b) Verify that the requirements to perform the test…arrow_forwardA USA based cable broadband company wants to investigate whether it's east coasts customers have a higher average customer satisfaction score than compared to it's west coast customers. The customer survey asks for a score between 1 and 5, with 1 being poor and 5 being excellent. 174 east coast customers are surveyed, and the sample mean is 3.35 with a sample standard deviation of 0.51. For the west coast, 355 customers are surveyed, and the sample mean is 3.24 with a sample standard deviation of 0.52.arrow_forwardThe manager of the shipping department of a mail-order operation located in New York advertises that the length of time it takes for customers in California to receive their orders is 8 days. However, the office has been receiving complaints from customers in California stating that orders do not arrive in time advertised. To learn more about this potential problem, the manager chose a random sample of 15 orders. The sample mean of delivery times was 12.25 days. The sample standard deviation was 3.67 days.The average time it takes for all California customers to receive their orders is to be estimated with a 99% confidence interval. a. The ? − or ? −value that should be used to construct this interval is b. The margin of error is equal toarrow_forward
- A college entrance exam company determined that a score of 23 on the mathematics portion of the exam suggests that a student is ready for college-level mathematics. To achieve this goal, the company recommends that students take a core curriculum of math courses in high school. Suppose a random sample of 150 students who completed this core set of courses results in a mean math score of 23.7 on the college entrance exam with a standard deviation of 3.7. Do these results suggest that students who complete the core curriculum are ready for college-level mathematics? That is, are they scoring above 23 on the math portion of the exam? Complete parts a) through d) below. b) Verify that the requirements to perform the test using the t-distribution are satisfied. Check all that apply. A. The students were randomly sampled. B. The students' test scores were independent of one another. C. The sample size is larger than 30. D. None of the requirements are satisfied.arrow_forward7) A tire manufacturer has been producing tires with an average life expectancy of 26,000 miles. Now the company is advertising that their new tires' life expectancy has increased. In order to test the legitimacy of their advertising campaign, an independent testing agency tested a sample of 85 of their tires. The agency found the mean of the 85 tires to be 27,000 miles and the standard deviation to be 3,970 miles. Use a 0.01 level of significance and test to determine whether the company is using legitimate advertising. (Show all seven steps.)arrow_forwardThe Sony Corporation produces an AM/FM Walkman that requires two AA batteries. The mean life of these batteries is 35.0 hours. The distribution of the battery lives closely follows the normal distribution with a standard deviation of 5.5 hours. As a part of their testing programme, Sony tests samples of 25 batteries. a)What fraction of the sample will have a mean useful life of greater than 34.5 hours? b)What fraction of the sample will have a mean useful life between 34.5 and 36.0 hours?arrow_forward
- Assume a media agency reports that it takes television streaming service subscribers in the U.S. an average of 6.60 days to watch the entire first season of a television series, with a standard deviation of 4.21 days. Scarlett is an analyst for an online television and movie streaming service company that targets to the 18-50 age bracket. She wants to determine if her company's customers exhibit shorter viewing rates for their series offerings. Scarlett plans to conduct a one-sample ?-z-test, with significance level of ?=0.05α=0.05, to test the null hypothesis, ?0:?=6.60 daysH0:μ=6.60 days, against the alternative hypothesis, ?1:?<6.60 days.H1:μ<6.60 days. The variable ?μ is the mean amount of time, in days, that it takes for customers to watch the first season of a television series. Scarlett selects a simple random sample of 740 customers who watched the first season of a television series from the company database of over 25,000 customers that qualified. She compiles the…arrow_forwardA college admissions officer believes that students enrolling from Shawnee school District have higher SAT scores than those who enroll from West River School District. A sample of 30 students from each district is selected. The average SAT score for the group from the Shawnee district is 656 with a standard deviation of 100. The average SAT score for the group from the West River district is 560 with a standard deviation of 90. Is the belief of the admissions officer substantiated?arrow_forward
arrow_back_ios
arrow_forward_ios
Recommended textbooks for you
- MATLAB: An Introduction with ApplicationsStatisticsISBN:9781119256830Author:Amos GilatPublisher:John Wiley & Sons Inc
 Probability and Statistics for Engineering and th...StatisticsISBN:9781305251809Author:Jay L. DevorePublisher:Cengage Learning
 Statistics for The Behavioral Sciences (MindTap C...StatisticsISBN:9781305504912Author:Frederick J Gravetter, Larry B. WallnauPublisher:Cengage Learning
  Elementary Statistics: Picturing the World (7th E...StatisticsISBN:9780134683416Author:Ron Larson, Betsy FarberPublisher:PEARSON
 The Basic Practice of StatisticsStatisticsISBN:9781319042578Author:David S. Moore, William I. Notz, Michael A. FlignerPublisher:W. H. Freeman
 Introduction to the Practice of StatisticsStatisticsISBN:9781319013387Author:David S. Moore, George P. McCabe, Bruce A. CraigPublisher:W. H. Freeman
MATLAB: An Introduction with Applications
Statistics
ISBN:9781119256830
Author:Amos Gilat
Publisher:John Wiley & Sons Inc
Probability and Statistics for Engineering and th...
Statistics
ISBN:9781305251809
Author:Jay L. Devore
Publisher:Cengage Learning
Statistics for The Behavioral Sciences (MindTap C...
Statistics
ISBN:9781305504912
Author:Frederick J Gravetter, Larry B. Wallnau
Publisher:Cengage Learning
Elementary Statistics: Picturing the World (7th E...
Statistics
ISBN:9780134683416
Author:Ron Larson, Betsy Farber
Publisher:PEARSON
The Basic Practice of Statistics
Statistics
ISBN:9781319042578
Author:David S. Moore, William I. Notz, Michael A. Fligner
Publisher:W. H. Freeman
Introduction to the Practice of Statistics
Statistics
ISBN:9781319013387
Author:David S. Moore, George P. McCabe, Bruce A. Craig
Publisher:W. H. Freeman