
MATLAB: An Introduction with Applications
6th Edition
ISBN: 9781119256830
Author: Amos Gilat
Publisher: John Wiley & Sons Inc
expand_more
expand_more
format_list_bulleted
Related questions
Question
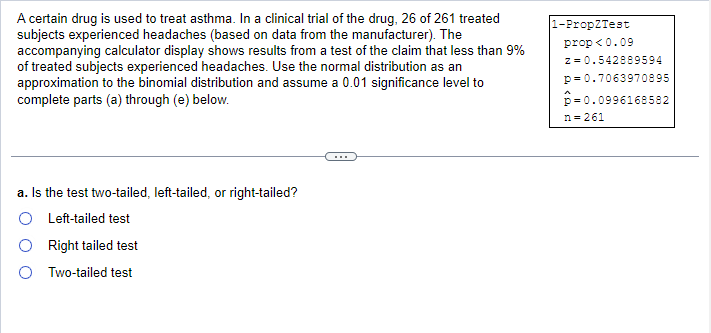

Transcribed Image Text:A certain drug is used to treat asthma. In a clinical trial of the drug, 26 of 261 treated
subjects experienced headaches (based on data from the manufacturer). The
accompanying calculator display shows results from a test of the claim that less than 9%
of treated subjects experienced headaches. Use the normal distribution as an
approximation to the binomial distribution and assume a 0.01 significance level to
complete parts (a) through (e) below.
a. Is the test two-tailed, left-tailed, or right-tailed?
O Left-tailed test
Right tailed test
Two-tailed test
1-Prop2Test
prop<0.09
z = 0.542889594
p=0.7063970895
-0.0996168582
n=261
Expert Solution
This question has been solved!
Explore an expertly crafted, step-by-step solution for a thorough understanding of key concepts.

This is a popular solution

Trending nowThis is a popular solution!

Step by stepSolved in 3 steps

Knowledge Booster

Similar questions
- A survey of the mean number of cents off that coupons give was conducted by randomly surveying one coupon per page from the coupon sections of a recent San Jose Mercury News. The following data were collected: 25; 70; 45; 65; 30; 55; 40; 40; 30; 55; $1.50; 40; 65; 40. Assume the underlying distribution is approximately normal.NOTE: If you are using a Student's t-distribution, you may assume that the underlying population is normally distributed. (In general, you must first prove that assumption, though.) Part (a) (i) Round your answer to two decimal places. x = ¢ (ii) Round your answer to two decimal places. sx = ¢ (iii) Enter an exact number as an integer, fraction, or decimal. n = (iv) Enter an exact number as an integer, fraction, or decimal. n − 1 = Which distribution should you use for this problem? (Enter your answer in the form z or tdf where df is the degrees of freedom.) Construct a 95% confidence interval for the population mean worth of coupons. (i) State the…arrow_forwardA certain drug is used to treat asthma. In a clinical trial of the drug, 22 of 277 treated subjects experienced headaches (based on data from the manufacturer). The accompanying calculator display shows results from a test of the claim that less than 8% of treated subjects experienced headaches. Use the normal distribution as an approximation to the binomial distribution and assume a 0.01 significance level to complete parts (a) through (e) below. b. What is the test statistic? c. What is the P-value?arrow_forwardThe accompanying table gives results from a study of words spoken in a day by men and women. Assume that both samples are independent simple random samples from populations having normal distributions. Use a 0.05 significance level to test the claim that the numbers of words spoken in a day by men vary more than the numbers of words spoken in a day by women. n x s Men 185 15,667.8 8,632.5 Women 212 16,215.5 7,301.2 What are the null and alternative hypotheses? A. H0: σ21≠σ22 H1: σ21=σ22 B. H0: σ21=σ22 H1: σ21>σ22 C. H0: σ21=σ22 H1: σ21<σ22 D. H0: σ21=σ22 H1: σ21≠σ22 Identify the test statistic. F= (Round to two decimal places as needed.) Use technology to identify the P-value. The P-value is (Round to three decimal places as needed.) What is the conclusion for this hypothesis test? A.Reject H0. There is insufficient evidence to support the claim that…arrow_forward
- 2. Which of the following are practical ways to assess normality of the residuals? Select all that apply a. Normal probability plots (the R command is qqnorm() b. Anderson-Darling tests. c. Shapiro-Wilks tests. d. Boxplots e. Just ask if they are normal, or, guess, because, who really cares?arrow_forwardA professor wants to know whether or not there is a difference in comprehension of a lab assignment among students depending on if the instructions are given all in text, or if they are given primarily with visual illustrations. She randomly divides her class into two groups of 15, gives one group instructions in text and the second group instructions with visual illustrations. The following data summarizes the scores the students received on a test given after the lab. Let the populations be normally distributed with a population standard deviation of 5.32 points for both the text and visual illustrations. Text (Group 1) Visual Illustrations (Group 2) 57.3 59 45.3 57.6 87.1 72.9 61.2 83.2 43.1 64 87.3 76.7 75.2 78.2 88.2 64.4 67.5 89 86.2 72.9 67.2 88.2 54.4 43.8 93 97.1 89.2 95.1 52 84.1 Is there evidence to suggest that a difference exists in the comprehension of the lab based on the…arrow_forwardA certain drug is used to treat asthma. In a clinical trial of the drug, 15 of 269 treated subjects experienced headaches (based on data from the manufacturer). The accompanying calculator display shows results from a test of the claim that less than 11% of treated subjects experienced headaches. Use the normal distribution as an approximation to the binomial distribution and assume a 0.01 significance level to complete parts (a) through (e) below. a. Is the test two-tailed, left-tailed, or right-tailed? Left-tailed test Right tailed test Two-tailed test b. What is the test statistic? Z= (Round to two decimal places as needed.) c. What is the P-value? P-value= (Round to four decimal places as needed.) 1-PropZTest prop <0.11 z = -2.843071658 p=0.0022340512 p=0.0557620818 ^ n = 269arrow_forward
- A certain drug is used to treat asthma. In a clinical trial of the drug, 18 of 268 treated subjects experienced headaches (based on data from the manufacturer). The accompanying calculator display shows results from a test of the claim that less than 11% of treated subjects experienced headaches. Use the normal distribution as an approximation to the binomial distribution and assume a 0.05 significance level to complete parts (a) through (e) below. a. Is the test two-tailed, left-tailed, or right-tailed? Left-tailed test Right tailed test Two-tailed test b. What is the test statistic? Z= (Round to two decimal places as needed.) 1-PropZTest prop < 0.11 z = -2.241213063 p=0.0125061385 p=0.0671641791 n = 268arrow_forwardListed below are systolic blood pressure measurements (mm Hg) taken from the right and left arms of the same woman. Assume that the paired sample data is a simple random sample and that the differences have a distribution that is approximately normal. Use a 0.05 significance level to test for a difference between the measurements from the two arms. What can be concluded? Right arm Left arm 151 136 120 134 134 181 174 180 156 138 In this example, Ha is the mean value of the differences d for the population of all pairs of data, where each individual difference d is defined as the measurement from the right arm minus the measurement from the left arm. What are the null and alternative hypotheses for the hypothesis test? O A. Ho: Hd = 0 O B. Ho: Hd 0 O C. Ho: Hd = 0 O D. Ho: Hd 0 H1: Ha>0arrow_forwardA certain drug is used to treat asthma. In a clinical trial of the drug, 20 of 289 treated subjects experienced headaches (based on data from the manufacturer). The accompanying calculator display shows results from a test of the claim that less than 9% of treated subjects experienced headaches. Use the normal distribution as an approximation to the binomial distribution and assume a 0.05 significance level to complete parts (a) through (e) below. a. Is the test two-tailed, left-tailed, or right-tailed? b. What is the test statistic? c. What is the P-value? d. What is the null hypothesis, and what do you conclude about it? Identify the null hypothesis. Decide whether to reject the null hypothesis. Choose the correct answer below. e. What is the final conclusion?arrow_forward
- A certain drug is used to treat asthma. In a clinical trial of the drug, 29 of 289 treated subjects experienced headaches (based on data from the manufacturer). The accompanying calculator display shows results from a test of the claim that less than 9% of treated subjects experienced headaches. Use the normal distribution as an approximation to the binomial distribution and assume a 0.05 significance level to complete parts (a) through (e) below. a. Is the test two-tailed, left-tailed, or right-tailed? O Right tailed test OTwo-tailed test Left-tailed test b. What is the test statistic? z = (Round to two decimal places as needed.) 1-Prop2Test prop<0.09 z-0.614582679 p-0.7305848219 p-0.1003460208 A n-289arrow_forwardA certain drug is used to treat asthma. In a clinical trial of the drug, 30 of 281 treated subjects experienced headaches (based on data from the manufacturer). The accompanying calculator display shows results from a test of the claim that less than 10% of treated subjects experienced headaches. Use the normal distribution as an approximation to the binomial distribution and assume a 0.05 significance level to complete parts (a) through (e) below. a. Is the test two-tailed, left-tailed, or right-tailed? Right tailed test Two-tailed test Left-tailed test b. What is the test statistic? Z= (Round to two decimal places as needed.) c. What is the P-value? 1-PropZTest prop 0.1 D. Ho: p = 0.1arrow_forward
arrow_back_ios
arrow_forward_ios
Recommended textbooks for you
- MATLAB: An Introduction with ApplicationsStatisticsISBN:9781119256830Author:Amos GilatPublisher:John Wiley & Sons Inc
 Probability and Statistics for Engineering and th...StatisticsISBN:9781305251809Author:Jay L. DevorePublisher:Cengage Learning
 Statistics for The Behavioral Sciences (MindTap C...StatisticsISBN:9781305504912Author:Frederick J Gravetter, Larry B. WallnauPublisher:Cengage Learning
  Elementary Statistics: Picturing the World (7th E...StatisticsISBN:9780134683416Author:Ron Larson, Betsy FarberPublisher:PEARSON
 The Basic Practice of StatisticsStatisticsISBN:9781319042578Author:David S. Moore, William I. Notz, Michael A. FlignerPublisher:W. H. Freeman
 Introduction to the Practice of StatisticsStatisticsISBN:9781319013387Author:David S. Moore, George P. McCabe, Bruce A. CraigPublisher:W. H. Freeman
MATLAB: An Introduction with Applications
Statistics
ISBN:9781119256830
Author:Amos Gilat
Publisher:John Wiley & Sons Inc
Probability and Statistics for Engineering and th...
Statistics
ISBN:9781305251809
Author:Jay L. Devore
Publisher:Cengage Learning
Statistics for The Behavioral Sciences (MindTap C...
Statistics
ISBN:9781305504912
Author:Frederick J Gravetter, Larry B. Wallnau
Publisher:Cengage Learning
Elementary Statistics: Picturing the World (7th E...
Statistics
ISBN:9780134683416
Author:Ron Larson, Betsy Farber
Publisher:PEARSON
The Basic Practice of Statistics
Statistics
ISBN:9781319042578
Author:David S. Moore, William I. Notz, Michael A. Fligner
Publisher:W. H. Freeman
Introduction to the Practice of Statistics
Statistics
ISBN:9781319013387
Author:David S. Moore, George P. McCabe, Bruce A. Craig
Publisher:W. H. Freeman