
MATLAB: An Introduction with Applications
6th Edition
ISBN: 9781119256830
Author: Amos Gilat
Publisher: John Wiley & Sons Inc
expand_more
expand_more
format_list_bulleted
Related questions
Question
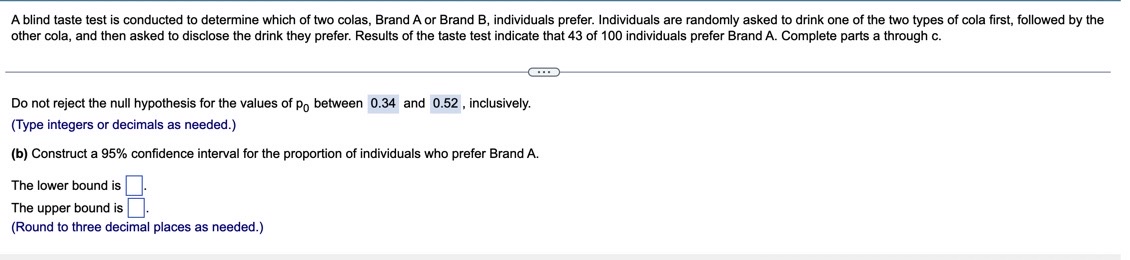

Transcribed Image Text:A blind taste test is conducted to determine which of two colas, Brand A or Brand B, individuals prefer. Individuals are randomly asked to drink one of the two types of cola first, followed by the
other cola, and then asked to disclose the drink they prefer. Results of the taste test indicate that 43 of 100 individuals prefer Brand A. Complete parts a through c.
Do not reject the null hypothesis for the values of po between 0.34 and 0.52 , inclusively.
(Type integers or decimals as needed.)
(b) Construct a 95% confidence interval for the proportion of individuals who prefer Brand A.
The lower bound is
The upper bound is
(Round to three decimal places as needed.)

Transcribed Image Text:(c) Suppose you changed the level of significance in conducting the hypothesis test to a = 0.01. What would happen to the range of values for Po for which the null
hypothesis is not rejected? Why does this make sense? Choose the correct answer below.
O A. The range of values would decrease because the corresponding confidence interval would decrease in size.
O B. The range of values would increase because the corresponding confidence interval would decrease in size.
OC. The range of values would decrease because the corresponding confidence interval would increase in size.
D. The range of values would increase because the corresponding confidence interval would increase in size.
Expert Solution
This question has been solved!
Explore an expertly crafted, step-by-step solution for a thorough understanding of key concepts.

This is a popular solution

Trending nowThis is a popular solution!

Step by stepSolved in 2 steps with 2 images

Knowledge Booster

Similar questions
- A Michigan study concerning preference for outdoor activities used a questionnaire with a six-point Likert-type response in which 1 designated "not important" and 6 designated "extremely important." A random sample of n1 = 44 adults were asked about fishing as an outdoor activity. The mean response was x1 = 4.9. Another random sample of n2 = 49 adults were asked about camping as an outdoor activity. For this group, the mean response was x2 = 4.1. From previous studies, it is known that ?1 = 1.5 and ?2 = 2.0. Does this indicate a difference (either way) regarding preference for camping versus preference for fishing as an outdoor activity? Use a 5% level of significance. Note: A Likert scale usually has to do with approval of or agreement with a statement in a questionnaire. For example, respondents are asked to indicate whether they "strongly agree," "agree," "disagree," or "strongly disagree" with the statement.arrow_forwardAn automotive company is conducting a survey concerning consumer buying preferences of a particular truck. The company wants to know whether the truck appearance, miles per gallon (MPG), or fixed price most influenced the consumer’s buying decision. A population sample of 500 individuals, both male and female, will be surveyed. State the null and alternative hypothesis if your were to test whether there is any difference in proportion using the three different criterion to purchase the given car based on gender.arrow_forwardAn LED light bulb manufacturer claims that the average lifespan of its 60-watt LED light bulbs is 27,000 hours. A corporate watchdog group is suspicious of the company's claim and thinks that the true average lifespan of the 60- watt LED light bulbs produced by the company may be less than the advertised 27,000 hours. The group collected and tested a random sample of 211 light bulbs and found the average lifespan of the sample was 26,941 hours. Use the p-value method to test the hypothesis that the mean lifespan of this brand of 60-watt LED light bulb is less than 27,000 hours, using a = 0.1. Assume the standard deviation of the lifespan of all such light bulbs is known to be 370 hours. State the null and alternative hypothesis for this test. Ho: ? H₁: ? Determine if this test is left-tailed, right-tailed, or two- tailed. right-tailed two-tailed left-tailed Should the standard normal (z) distribution or Student's (t) distribution be used for this test? The Student's t distribution…arrow_forward
- A random sample of n1 = 157 people ages 16 to 19 were taken from the island of Oahu, Hawaii, and 12 were found to be high school dropouts. Another random sample of n2 = 129 people ages 16 to 19 were taken from Sweetwater County, Wyoming, and 6 were found to be high school dropouts. Do these data indicate that the population proportion of high school dropouts on Oahu is different (either way) from that of Sweetwater County? Use a 1% level of significance. (a) What is the level of significance? What is the value of the sample test statistic? (Test the difference p1 − p2. Do not use rounded values. Round your final answer to two decimal places.) (c) Find (or estimate) the P-value. (Round your answer to four decimal places.)arrow_forwardUse SPSS for this Application Exercise: A health psychologist want to investigate whether there is a relationship between sex and food preference. The psychologist gave participants a questionnaire that asked which food the participants would choose to eat given the choice. What can be concluded with an a of 0.05? Food Sex spaghetti carrots donuts female 20 16 21 male 25 18 i. What is the appropriate test statistic? --Select- Compute the statistic selected in a): ii Obtain/compute the appropriate values to make a decision about Ho- p-value = Decision: -Select-- i Compute the corresponding effect size(s) and indicate magnitude(s). If not appropriate, input and/or select "na" below. Effect Size = ]: Magnitude: -Select-- iv I Make an interpretation based on the results. O There is a significant negative relationship between sex and food preference. O There is a significant food preference difference between sex. O Food preference and sex are independent.arrow_forwardThe records of a light bulb manufacturer show that, when the manufacturing machinery is working correctly, the defect rate (due to imperfections in the material used) is 1%. The manufacturer's control department periodically tests samples of the bulbs, and when 1.25% or more are defective, they call repair technicians for service. The control department is going to take a random sample of 4400 light bulbs. Let p be the proportion of defective light bulbs in the sample assuming the machinery is working correctly. A) find the mean of p b)find the standard deviation of p c)Compute an approximation for P≥p0.0125, which is the probability that, assuming the machinery is working correctly, the repair technicians will be called. Round your answer to four decimal places.arrow_forward
- The records of a light bulb manufacturer show that, when the manufacturing machinery is working correctly, the defect rate (due to imperfections in the material used) is 1%. The manufacturer's control department periodically tests samples of the bulbs, and when 1.25% or more are defective, they call repair technicians for service. The control department is going to take a random sample of 4400 light bulbs. Let p be the proportion of defective light bulbs in the sample assuming the machinery is working correctly. Answer the following. (If necessary, consult a list of formulas.) (a) Find the mean of p. (b) Find the standard deviation of p. (c) Compute an approximation for P(P ≥ 0.0125), which is the probability that, assuming the machinery is working correctly, the repair technicians will be called. Round your answer to four decimal places.arrow_forwardDetermine if the samples are independent or related. Two formulations of a new whitening soap are compared to their whitening effect. A random sample of 40 potential users of the soap is selected. Each person uses a randomization mechanism to determine which formulation is applied on the left arm so that the other formulation is applied on the right arm. After two weeks, they measured the effect of each formulation.arrow_forwardA survey is conducted to determine if there is a difference in the proportion of students, parents, and What are the appropriate hypotheses to determine if the distribution of response differs among these three populations? teachers who volunteer at least once a month. To investigate, a random sample of 45 students, 25 parents, and 12 teachers was selected from a large high school. The data are displayed in the table. O Ho: There is a difference in the distribution of responses among these three populations. Hg: There is no difference in the distribution of Student Parent Teacher responses among these three populations. 12 O Ho: There is no difference in the distribution of Yes 24 Volunteer? responses among these three populations. Hg: There is a difference in the distribution of No 21 13 response among these three populations. Họ: There is no association between the type of person who is surveyed and the response. Hạ: There is an association between the type of person who is surveyed…arrow_forward
- Is there an association between daily screen time and exercise habits in high school students? Mia selects a random sample of 123 high school students and categorizes them into 1 of 3 categories of screen time and whether they exercise. She would like to determine if there is convincing evidence of an association. Let = 0.05. What are the hypotheses for this test? H0: There is an association between daily screen time and exercise habits in high school students.Ha: There is no association between daily screen time and exercise habits in high school students.H0: There is no association between daily screen time and exercise habits in high school students.Ha: There is an association between daily screen time and exercise habits in high school students.H0: There is no difference in the distribution of daily screen time and exercise habits in high school students.Ha: There is a difference in the distribution of daily screen time and exercise habits in high school students.H0: There is a…arrow_forwardA researcher randomly assigns college freshmen to either of two experimental conditions. Because both groups consist of college freshmen, someone claims that it is appropriate to use a t test for the two related samples. Comments?arrow_forwardA Michigan study concerning preference for outdoor activities used a questionnaire with a six-point Likert-type response in which 1 designated "not important" and 6 designated "extremely important." A random sample of n1 = 41 adults were asked about fishing as an outdoor activity. The mean response was x1 = 4.9. Another random sample of n2 = 50 adults were asked about camping as an outdoor activity. For this group, the mean response was x2 = 5.7. From previous studies, it is known that ?1 = 1.6 and ?2 = 1.5. Does this indicate a difference (either way) regarding preference for camping versus preference for fishing as an outdoor activity? Use a 5% level of significance.Note: A Likert scale usually has to do with approval of or agreement with a statement in a questionnaire. For example, respondents are asked to indicate whether they "strongly agree," "agree," "disagree," or "strongly disagree" with the statement. (a) What is the level of significance? .05 State the null and alternate…arrow_forward
arrow_back_ios
SEE MORE QUESTIONS
arrow_forward_ios
Recommended textbooks for you
- MATLAB: An Introduction with ApplicationsStatisticsISBN:9781119256830Author:Amos GilatPublisher:John Wiley & Sons Inc
 Probability and Statistics for Engineering and th...StatisticsISBN:9781305251809Author:Jay L. DevorePublisher:Cengage Learning
 Statistics for The Behavioral Sciences (MindTap C...StatisticsISBN:9781305504912Author:Frederick J Gravetter, Larry B. WallnauPublisher:Cengage Learning
  Elementary Statistics: Picturing the World (7th E...StatisticsISBN:9780134683416Author:Ron Larson, Betsy FarberPublisher:PEARSON
 The Basic Practice of StatisticsStatisticsISBN:9781319042578Author:David S. Moore, William I. Notz, Michael A. FlignerPublisher:W. H. Freeman
 Introduction to the Practice of StatisticsStatisticsISBN:9781319013387Author:David S. Moore, George P. McCabe, Bruce A. CraigPublisher:W. H. Freeman
MATLAB: An Introduction with Applications
Statistics
ISBN:9781119256830
Author:Amos Gilat
Publisher:John Wiley & Sons Inc
Probability and Statistics for Engineering and th...
Statistics
ISBN:9781305251809
Author:Jay L. Devore
Publisher:Cengage Learning
Statistics for The Behavioral Sciences (MindTap C...
Statistics
ISBN:9781305504912
Author:Frederick J Gravetter, Larry B. Wallnau
Publisher:Cengage Learning
Elementary Statistics: Picturing the World (7th E...
Statistics
ISBN:9780134683416
Author:Ron Larson, Betsy Farber
Publisher:PEARSON
The Basic Practice of Statistics
Statistics
ISBN:9781319042578
Author:David S. Moore, William I. Notz, Michael A. Fligner
Publisher:W. H. Freeman
Introduction to the Practice of Statistics
Statistics
ISBN:9781319013387
Author:David S. Moore, George P. McCabe, Bruce A. Craig
Publisher:W. H. Freeman