
MATLAB: An Introduction with Applications
6th Edition
ISBN: 9781119256830
Author: Amos Gilat
Publisher: John Wiley & Sons Inc
expand_more
expand_more
format_list_bulleted
Related questions
Concept explainers
Question
| A bicycle safety organization claims that fatal bicycle accidents are uniformly distributed throughout the week. The table on the right shows the day of the week for which
777 randomly selected fatal bicycle accidents occurred. At. α=0.10, can you reject the claim that the distribution isuniform? Complete parts a through d below.
|
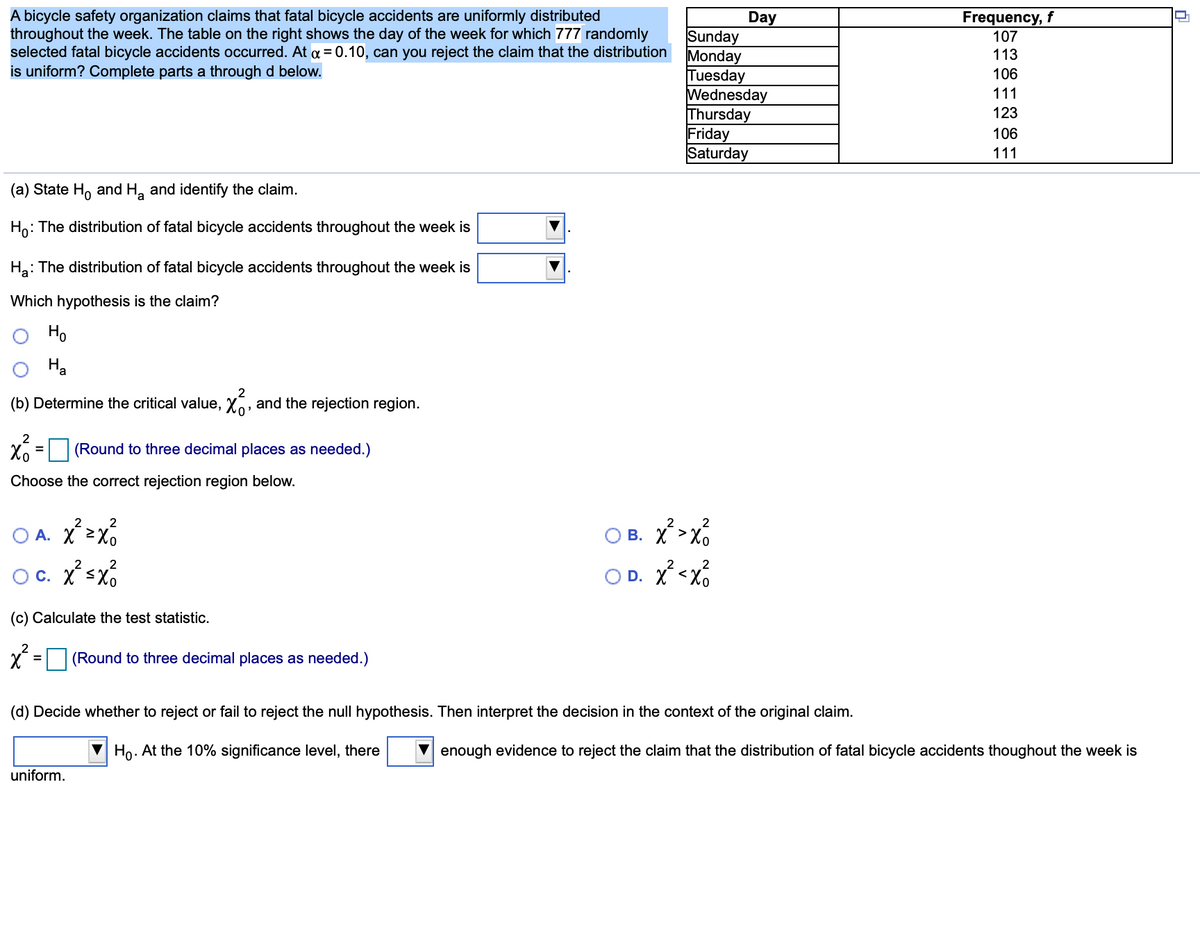

Transcribed Image Text:A bicycle safety organization claims that fatal bicycle accidents are uniformly distributed
throughout the week. The table on the right shows the day of the week for which 777 randomly
selected fatal bicycle accidents occurred. At a = 0.10, can you reject the claim that the distribution
is uniform? Complete parts a through d below.
Frequency, f
107
Day
Sunday
Monday
Tuesday
Wednesday
Thursday
Friday
Saturday
113
106
111
123
106
111
(a) State H, and H, and identify the claim.
Ho: The distribution of fatal bicycle accidents throughout the week is
Ha: The distribution of fatal bicycle accidents throughout the week is
Which hypothesis is the claim?
Ho
Ha
2
(b) Determine the critical value, Xo, and the rejection region.
2
X6 = (Round to three decimal places as needed.)
%3D
Choose the correct rejection region below.
2
B. X>x6
2
2
O A. X>x%
2
2
Oc. Xsx
O D. X <X6
(c) Calculate the test statistic.
(Round to three decimal places as needed.)
(d) Decide whether to reject or fail to reject the null hypothesis. Then interpret the decision in the context of the original claim.
V Ho. At the 10% significance level, there
enough evidence to reject the claim that the distribution of fatal bicycle accidents thoughout the week is
uniform.
Expert Solution
This question has been solved!
Explore an expertly crafted, step-by-step solution for a thorough understanding of key concepts.

Step by stepSolved in 3 steps

Knowledge Booster


Learn more about
Need a deep-dive on the concept behind this application? Look no further. Learn more about this topic, statistics and related others by exploring similar questions and additional content below.Similar questions
- a. Find X23,10. Draw the distribution and identify the x²-value in the distribution. b. Find F24,30,.05. Draw the distribution and identify the F-value in the distribution. c. Find t18,005. Draw the distribution and identify the t-value in the distribution.arrow_forwardSuppose that a customer is purchasing a car. He conducts an experiment in which he puts 10 gallons of gas in the car and drives it until it runs out of gas. He conducts this experiment 15 times on each car and records the number of miles driven. Full data set Car 1 216 243 205 242 239 297 295 172 270 251 165 310 265 316 278 Car 2 231 220 223 205 245 257 242 292 248 252 287 255 250 293 251 Median for Car 2 M=___________mi / 10 gal (Type an integer or decimal rounded to one decimal place as needed.) Range for Car 1 R=__________mi / 10 gal (Type an integer or decimal rounded to one decimal place as needed.) Range for Car 2 R=__________mi / 10 gal (Type an integer or decimal rounded to one decimal place as needed.) Sample standard deviation for Car 1 s=_________mi / 10 gal (Type an integer or decimal rounded to one decimal place as needed.) Sample standard deviation…arrow_forwardAssume the readings on thermometers are normally distributed with a mean of 0°C and a standard deviation of 1.00°C. Find the probability that a randomly selected thermometer reads between - 1.94 and -1.06 and draw a sketch of the region. Click to view page 1 of the table. Click to view page 2 of the table. Sketch the region. Choose the correct graph below. O A. O B. O C. W W -1.94 -1.06 -1.94 -1.06 -1.94 -1.06 The probability is (Round to four decimal places as needed.)arrow_forward
- 21 d-farrow_forwardAssume that the readings on the thermometers are normally distributed with a mean of 0° and standard deviation of 1.00°C. A thermometer is randomly selected and tested. Draw a sketch and find the temperature reading corresponding to P34, the 84th percentile. This is the temperature reading separating the bottom 84% from the top 16%. Click to view page 1 of the table. Click to view page 2 of the table. Which graph represents P ? Choose the correct graph below. 84 A. В. OC. D. Ay X The temperature for P84 is approximately (Round to two decimal places as needed.)arrow_forwardFind the z-scores for which 80% of the distribution's area lies between -z and z. Click to view page 1 of the table. Click to view page 2 of the table. The Z-scores are (Use a comma to separate answers as needed. Round to two decimal places as needed.) Carrow_forward
arrow_back_ios
arrow_forward_ios
Recommended textbooks for you
- MATLAB: An Introduction with ApplicationsStatisticsISBN:9781119256830Author:Amos GilatPublisher:John Wiley & Sons Inc
 Probability and Statistics for Engineering and th...StatisticsISBN:9781305251809Author:Jay L. DevorePublisher:Cengage Learning
 Statistics for The Behavioral Sciences (MindTap C...StatisticsISBN:9781305504912Author:Frederick J Gravetter, Larry B. WallnauPublisher:Cengage Learning
  Elementary Statistics: Picturing the World (7th E...StatisticsISBN:9780134683416Author:Ron Larson, Betsy FarberPublisher:PEARSON
 The Basic Practice of StatisticsStatisticsISBN:9781319042578Author:David S. Moore, William I. Notz, Michael A. FlignerPublisher:W. H. Freeman
 Introduction to the Practice of StatisticsStatisticsISBN:9781319013387Author:David S. Moore, George P. McCabe, Bruce A. CraigPublisher:W. H. Freeman
MATLAB: An Introduction with Applications
Statistics
ISBN:9781119256830
Author:Amos Gilat
Publisher:John Wiley & Sons Inc
Probability and Statistics for Engineering and th...
Statistics
ISBN:9781305251809
Author:Jay L. Devore
Publisher:Cengage Learning
Statistics for The Behavioral Sciences (MindTap C...
Statistics
ISBN:9781305504912
Author:Frederick J Gravetter, Larry B. Wallnau
Publisher:Cengage Learning
Elementary Statistics: Picturing the World (7th E...
Statistics
ISBN:9780134683416
Author:Ron Larson, Betsy Farber
Publisher:PEARSON
The Basic Practice of Statistics
Statistics
ISBN:9781319042578
Author:David S. Moore, William I. Notz, Michael A. Fligner
Publisher:W. H. Freeman
Introduction to the Practice of Statistics
Statistics
ISBN:9781319013387
Author:David S. Moore, George P. McCabe, Bruce A. Craig
Publisher:W. H. Freeman