1. Construct an exponential smoothing model for the Amazon Revenue Data. a. Use 0.7 as the smoothing constant and b. 7,131 as the initial value C. What is your prediction for Q1, 2021? d. Calculate the MAD, MSE, and MAPE for this time series model. 2. Construct a moving average model (k=3) for the Amazon Revenue Data. 3. Compare the smoothing and moving average models. Which is more accurate? A B C 20 12345690022===≈ Year Quarter Revenue 2010 1 7,131.00 2010 2 6,566.00 2010 3 7,560.00 2010 4 12,947.00 2011 1 9,857.00 7 2011 2 9,913.00 8 2011 3 10,876.00 2011 4 17,431.00 10 2012 1 13,185.00 11 2012 2 12,834.00 12 2012 3 13,806.00 13 2012 4 21,268.00 14 2013 1 16,070.00 15 2013 2 15,704.00 16 2013 3 17,091.00 17 2013 4 25,587.00 18 2014 1 19,741.00 19 2014 2 19,340.00 20 2014 3 20,578.00 21 2014 4 29,329.00 22 2015 1 22,717.00 23 2015 2 23,184.00 24 2015 3 25,358.00 25 2015 4 35,747.00 26 2016 1 29,128.00 27 2016 2 30,404.00 28 2016 3 32,714.00 29 2016 4 43,741.00 30 2017 1 35,714.00 31 2017 2 37,955.00 32 2017 3 43,744.00 33 2017 4 60,453.00 34 2018 1 51,042.00 35 2018 2 52,886.00 36 2018 3 56,576.00 37 2018 4 72,383.00 38 2019 1 59,700.00 39 2019 2 63,404.00 40 2019 3 69,982.00 41 2019 4 87,436.00 42 2020 1 75,452.00 43 2020 2 88,912.00 44 2020 3 96,145.00 45 2020 4 125,555.00
1. Construct an exponential smoothing model for the Amazon Revenue Data. a. Use 0.7 as the smoothing constant and b. 7,131 as the initial value C. What is your prediction for Q1, 2021? d. Calculate the MAD, MSE, and MAPE for this time series model. 2. Construct a moving average model (k=3) for the Amazon Revenue Data. 3. Compare the smoothing and moving average models. Which is more accurate? A B C 20 12345690022===≈ Year Quarter Revenue 2010 1 7,131.00 2010 2 6,566.00 2010 3 7,560.00 2010 4 12,947.00 2011 1 9,857.00 7 2011 2 9,913.00 8 2011 3 10,876.00 2011 4 17,431.00 10 2012 1 13,185.00 11 2012 2 12,834.00 12 2012 3 13,806.00 13 2012 4 21,268.00 14 2013 1 16,070.00 15 2013 2 15,704.00 16 2013 3 17,091.00 17 2013 4 25,587.00 18 2014 1 19,741.00 19 2014 2 19,340.00 20 2014 3 20,578.00 21 2014 4 29,329.00 22 2015 1 22,717.00 23 2015 2 23,184.00 24 2015 3 25,358.00 25 2015 4 35,747.00 26 2016 1 29,128.00 27 2016 2 30,404.00 28 2016 3 32,714.00 29 2016 4 43,741.00 30 2017 1 35,714.00 31 2017 2 37,955.00 32 2017 3 43,744.00 33 2017 4 60,453.00 34 2018 1 51,042.00 35 2018 2 52,886.00 36 2018 3 56,576.00 37 2018 4 72,383.00 38 2019 1 59,700.00 39 2019 2 63,404.00 40 2019 3 69,982.00 41 2019 4 87,436.00 42 2020 1 75,452.00 43 2020 2 88,912.00 44 2020 3 96,145.00 45 2020 4 125,555.00

Practical Management Science
6th Edition
ISBN:9781337406659
Author:WINSTON, Wayne L.
Publisher:WINSTON, Wayne L.
Chapter9: Decision Making Under Uncertainty
Section9.6: The Role Of Risk Aversion
Problem 26P

Related questions
Question
100%
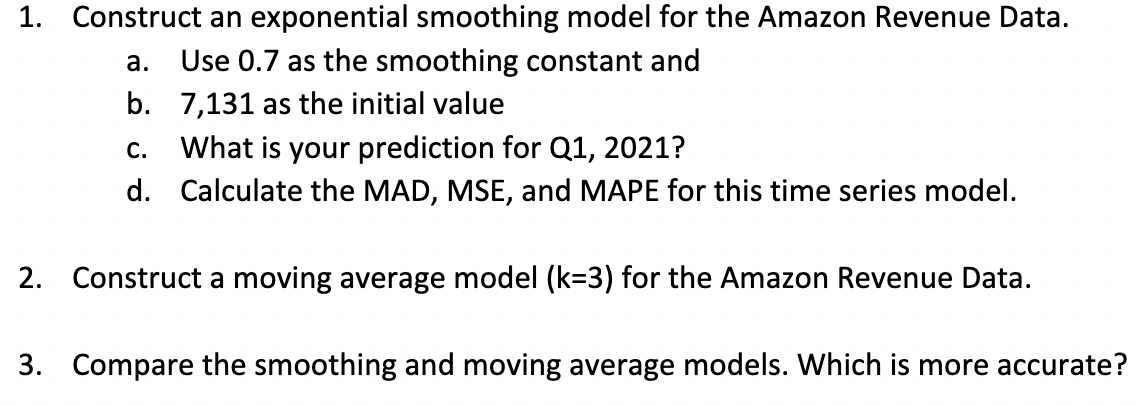
Transcribed Image Text:1. Construct an exponential smoothing model for the Amazon Revenue Data.
a.
Use 0.7 as the smoothing constant and
b. 7,131 as the initial value
C.
What is your prediction for Q1, 2021?
d. Calculate the MAD, MSE, and MAPE for this time series model.
2. Construct a moving average model (k=3) for the Amazon Revenue Data.
3. Compare the smoothing and moving average models. Which is more accurate?
Transcribed Image Text:A B
C
20
12345690022===≈
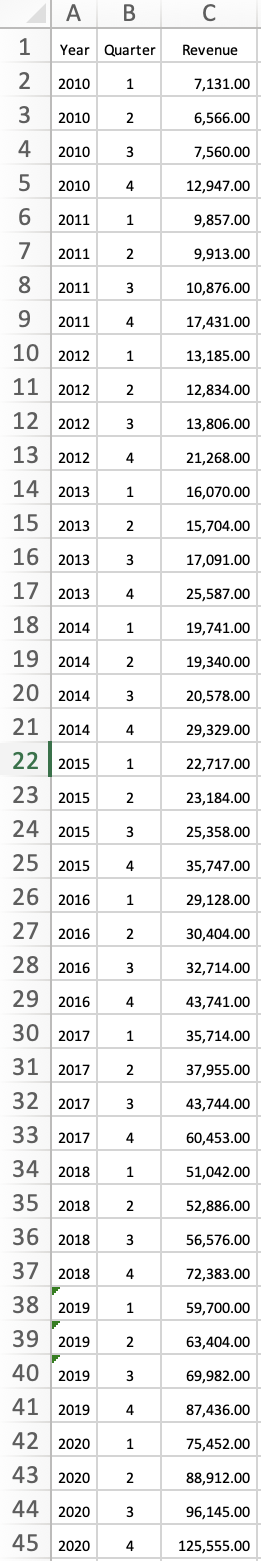
Year Quarter
Revenue
2010
1
7,131.00
2010
2
6,566.00
2010
3
7,560.00
2010
4
12,947.00
2011
1
9,857.00
7
2011
2
9,913.00
8 2011 3
10,876.00
2011
4
17,431.00
10
2012 1
13,185.00
11
2012
2
12,834.00
12
2012
3
13,806.00
13
2012
4
21,268.00
14
2013
1
16,070.00
15
2013 2
15,704.00
16 2013 3
17,091.00
17 2013 4
25,587.00
18 2014 1
19,741.00
19 2014 2
19,340.00
20 2014 3
20,578.00
21 2014 4
29,329.00
22 2015 1
22,717.00
23 2015 2
23,184.00
24 2015 3
25,358.00
25 2015 4
35,747.00
26 2016 1
29,128.00
27 2016 2
30,404.00
28 2016 3
32,714.00
29 2016 4
43,741.00
30 2017 1
35,714.00
31 2017 2
37,955.00
32 2017 3
43,744.00
33 2017 4
60,453.00
34 2018
1
51,042.00
35 2018
2
52,886.00
36 2018 3
56,576.00
37 2018 4
72,383.00
38 2019
1
59,700.00
39 2019
2
63,404.00
40 2019
3
69,982.00
41 2019
4
87,436.00
42 2020
1
75,452.00
43 2020
2
88,912.00
44 2020
3
96,145.00
45
2020
4
125,555.00
Expert Solution
This question has been solved!
Explore an expertly crafted, step-by-step solution for a thorough understanding of key concepts.

This is a popular solution!

Trending now
This is a popular solution!

Step by step
Solved in 2 steps

Recommended textbooks for you
Practical Management Science
Operations Management
ISBN:
9781337406659
Author:
WINSTON, Wayne L.
Publisher:
Cengage,
Practical Management Science
Operations Management
ISBN:
9781337406659
Author:
WINSTON, Wayne L.
Publisher:
Cengage,