MATLAB: An Introduction with Applications
6th Edition
ISBN: 9781119256830
Author: Amos Gilat
Publisher: John Wiley & Sons Inc
expand_more
expand_more
format_list_bulleted
Question

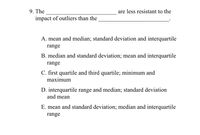
Transcribed Image Text:9. The
impact of outliers than the
are less resistant to the
A. mean and median; standard deviation and interquartile
range
B. median and standard deviation; mean and interquartile
range
C. first quartile and third quartile; minimum and
maximum
D. interquartile range and median; standard deviation
and mean
E. mean and standard deviation; median and interquartile
range
Expert Solution
arrow_forward
Step 1
We know that .;
Outliers are extreme values .
Mean and standard deviation depends on all observations.
Interquartile range depends on 50 % percent observation
Median depends only two observations
Step by stepSolved in 2 steps

Knowledge Booster
Similar questions
- 3. Describe why data description using graphical methods sometimes is not sufficient b. measures of central tendency sometimes missleadarrow_forwardOutliers are extremely small or large data values that require special consideration. True or False?arrow_forwardTwo tools commonly used to test how close the dispersion of data matches the distribution shape of a normal curve are:arrow_forward
- Find the 5 number summary for the data shown 10 17 40 41 46 52 53 59 65 98 5 number summary: IQR: }¯ The 1.5 x IQR rule states that values between and are likely not outliers.arrow_forwardApproximate the measures of center for following GFDT. Data Frequency 50 - 54 2 55 - 59 3 60 - 64 5 65 - 69 10 70 - 74 18 75 - 79 15 80 - 84 9 85 - 89 0 90 - 94 5 mode = median = mean =arrow_forward26. How can you describe the spread of data using a box-and-whisker plot?arrow_forward
- Define the Test a slope for significance?arrow_forwardThe mating call frequency of American bird-voiced tree frogs appears to be related to the outside temperature. The scatterplot below show this relationship. Summary measures are: mean of frequency = 6.01 notes per second, standard deviation of frequency = 1.78 notes per second, mean of temperature = 22.61 degrees Celsius, standard deviation of temperature = 3.35 degrees Celsius, and correlation between frequency and temperature = 0.85 Compute the slope what the slope means in this context. Compute the y-intercept and interpret what the y-intercept means in this context. Describe the relationship between Temperature and Frequency. Predict the frequency when temperature is 23 and 36 degrees. Do you see any problems with wither of the predictions?arrow_forwardneed range and standard deviationarrow_forward
arrow_back_ios
SEE MORE QUESTIONS
arrow_forward_ios
Recommended textbooks for you
 MATLAB: An Introduction with ApplicationsStatisticsISBN:9781119256830Author:Amos GilatPublisher:John Wiley & Sons Inc
 Probability and Statistics for Engineering and th...StatisticsISBN:9781305251809Author:Jay L. DevorePublisher:Cengage Learning
 Statistics for The Behavioral Sciences (MindTap C...StatisticsISBN:9781305504912Author:Frederick J Gravetter, Larry B. WallnauPublisher:Cengage Learning
 Elementary Statistics: Picturing the World (7th E...StatisticsISBN:9780134683416Author:Ron Larson, Betsy FarberPublisher:PEARSON
 The Basic Practice of StatisticsStatisticsISBN:9781319042578Author:David S. Moore, William I. Notz, Michael A. FlignerPublisher:W. H. Freeman
 Introduction to the Practice of StatisticsStatisticsISBN:9781319013387Author:David S. Moore, George P. McCabe, Bruce A. CraigPublisher:W. H. Freeman

MATLAB: An Introduction with Applications
Statistics
ISBN:9781119256830
Author:Amos Gilat
Publisher:John Wiley & Sons Inc

Probability and Statistics for Engineering and th...
Statistics
ISBN:9781305251809
Author:Jay L. Devore
Publisher:Cengage Learning

Statistics for The Behavioral Sciences (MindTap C...
Statistics
ISBN:9781305504912
Author:Frederick J Gravetter, Larry B. Wallnau
Publisher:Cengage Learning

Elementary Statistics: Picturing the World (7th E...
Statistics
ISBN:9780134683416
Author:Ron Larson, Betsy Farber
Publisher:PEARSON

The Basic Practice of Statistics
Statistics
ISBN:9781319042578
Author:David S. Moore, William I. Notz, Michael A. Fligner
Publisher:W. H. Freeman

Introduction to the Practice of Statistics
Statistics
ISBN:9781319013387
Author:David S. Moore, George P. McCabe, Bruce A. Craig
Publisher:W. H. Freeman