MATLAB: An Introduction with Applications
6th Edition
ISBN: 9781119256830
Author: Amos Gilat
Publisher: John Wiley & Sons Inc
expand_more
expand_more
format_list_bulleted
Question
thumb_up100%
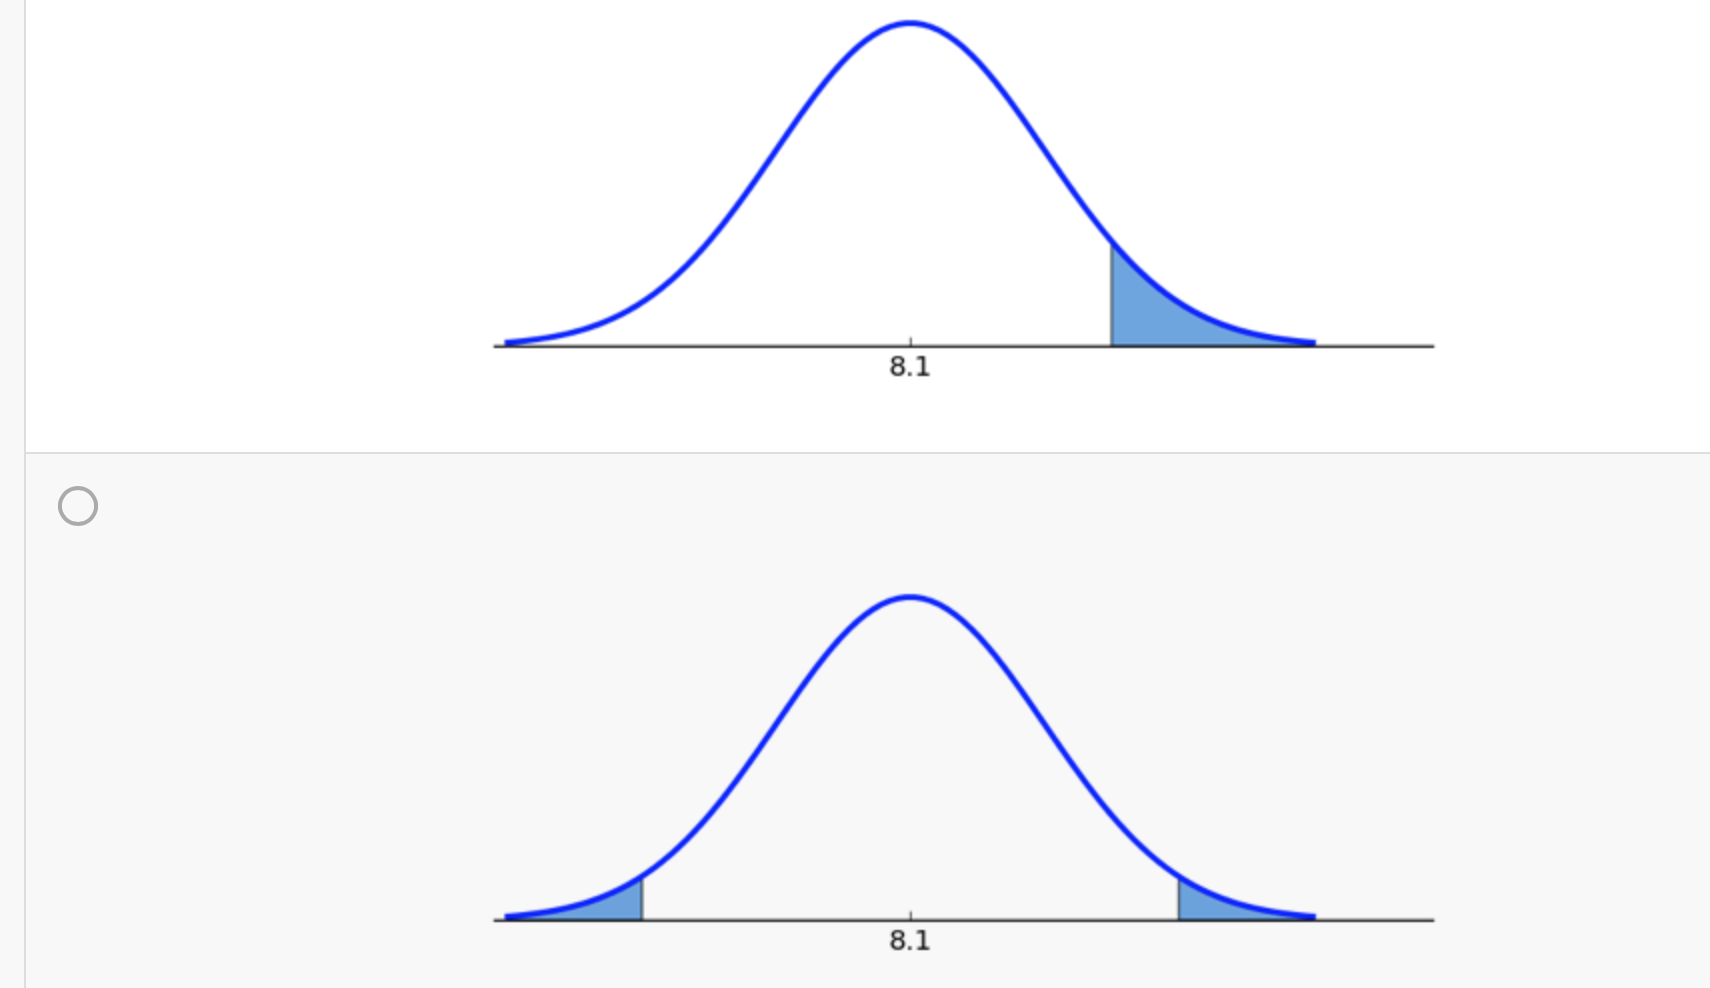
Which graph below corresponds to the following hypothesis test?
H0:p≤8.1, Ha:p>8.1

Transcribed Image Text:8.1
Expert Solution
This question has been solved!
Explore an expertly crafted, step-by-step solution for a thorough understanding of key concepts.
This is a popular solution
Trending nowThis is a popular solution!
Step by stepSolved in 5 steps with 2 images

Knowledge Booster
Learn more about
Need a deep-dive on the concept behind this application? Look no further. Learn more about this topic, statistics and related others by exploring similar questions and additional content below.Similar questions
- What is the P(-2.5 < t < 2.5) with a sample size of 15 ?arrow_forwardConstruct a 95% confidence interval for p1 - p2 for a survey that finds 30% of 240 males and 41% of 200 females are opposed to the death penalty. Group of answer choices a.(-0.200, -0.021) b.(-1.532, 1.342) c.(-1.324, 1.512) d.(-0.561, 0.651)arrow_forwardA die is rolled 120 times to see if it is fair. The table below shows the frequencies for each of the six possible outcomes. Use a level of significance of a = 0.01. a. Complete the rest of the table by filling in the expected frequencies (enter your answers in fraction form): Frequency of Dice Values Outcome Frequency Expected Frequency 1 21 3 3 24 4 21 21 30 b. What are the null and alternative hypotheses? Ho: Select an answer 2.arrow_forward
- A national survey reports that the average number of screens (TVs, computers, tablets, and smartphones) in a single-family household 9.5. You believe that average may be different in Hartsville. State the null and alternative hypothesis for the claim that the average number of screens per household in Hartsville is not 9.5. Select your answer from one of the following options. a. ?0:?≥9.5??:?<9.5 b. ?0:?=9.5??:?≠9.5 c. ?0:?>9.5??:?≤9.5 d. ?0:?≠9.5??:?=9.5 e. ?0:?≤9.5??:?>9.5arrow_forwardAccording to a recent study in New York, 15% of shoppers are unfairly being charged sales tax in non-taxable items. Mr. Hypothesis feels this proportion is too low. He tests his belief by conducting a survey of 200 random shoppers. Which of the following would be the alternate hypothesis? a. The percent of shoppers unfairly being charged sales tax on non-taxable items < .15 b. The percent of shoppers unfairly being charged sales tax on non-taxable items > .15 c. The percent of shoppers unfairly being charged sales tax on non-taxable items = .15arrow_forwardLet p be the population proportion of successes, where a success is a household in the country that owns a pet. State Ho and Ha. Select the correct choice below and fill in the answer boxes to complete your choice.arrow_forward
- Solve for the p-value.arrow_forwardA confidence interval for a mean is (−13,14)-13,14. This interval would be wider if A.)The sample mean was larger or the variability of the data was larger. B.) The variability of the data was larger, or the investigator wanted to be more confident. C.) The investigator wanted to be more confident of their results, or there was more information. D.) The variability of the data was small, or the sample mean was larger. E.) None of the above.arrow_forwardIf the sample space is C = C1UC2 and if P(C1) = 0.62 and P(C2) = 0.55, find Q.2. P(C1NC2).arrow_forward
- Approximately what is the mean success score for those who wanted to quit the hypnosis group? a) the graph does not display the mean. b) -1.00 c) 1.00 d) 0.00arrow_forwardclaim: Most adults would not erase all of their personal information online if they could. A software firm survey of 585 randomly selected adults showed that 49.3% of them would erase all of their personal information online if they could. Make a subjective estimate to decide whether the results are significantly low or significantly high, then state a conclusion about the original claim.arrow_forwardA researcher rejected the null where r(56) = .050, p = .27. Was the researcher correct in rejecting the null? Group of answer choices Yes Noarrow_forward
arrow_back_ios
arrow_forward_ios
Recommended textbooks for you
 MATLAB: An Introduction with ApplicationsStatisticsISBN:9781119256830Author:Amos GilatPublisher:John Wiley & Sons Inc
 Probability and Statistics for Engineering and th...StatisticsISBN:9781305251809Author:Jay L. DevorePublisher:Cengage Learning
 Statistics for The Behavioral Sciences (MindTap C...StatisticsISBN:9781305504912Author:Frederick J Gravetter, Larry B. WallnauPublisher:Cengage Learning
 Elementary Statistics: Picturing the World (7th E...StatisticsISBN:9780134683416Author:Ron Larson, Betsy FarberPublisher:PEARSON
 The Basic Practice of StatisticsStatisticsISBN:9781319042578Author:David S. Moore, William I. Notz, Michael A. FlignerPublisher:W. H. Freeman
 Introduction to the Practice of StatisticsStatisticsISBN:9781319013387Author:David S. Moore, George P. McCabe, Bruce A. CraigPublisher:W. H. Freeman

MATLAB: An Introduction with Applications
Statistics
ISBN:9781119256830
Author:Amos Gilat
Publisher:John Wiley & Sons Inc

Probability and Statistics for Engineering and th...
Statistics
ISBN:9781305251809
Author:Jay L. Devore
Publisher:Cengage Learning

Statistics for The Behavioral Sciences (MindTap C...
Statistics
ISBN:9781305504912
Author:Frederick J Gravetter, Larry B. Wallnau
Publisher:Cengage Learning

Elementary Statistics: Picturing the World (7th E...
Statistics
ISBN:9780134683416
Author:Ron Larson, Betsy Farber
Publisher:PEARSON

The Basic Practice of Statistics
Statistics
ISBN:9781319042578
Author:David S. Moore, William I. Notz, Michael A. Fligner
Publisher:W. H. Freeman

Introduction to the Practice of Statistics
Statistics
ISBN:9781319013387
Author:David S. Moore, George P. McCabe, Bruce A. Craig
Publisher:W. H. Freeman