MATLAB: An Introduction with Applications
6th Edition
ISBN: 9781119256830
Author: Amos Gilat
Publisher: John Wiley & Sons Inc
expand_more
expand_more
format_list_bulleted
Concept explainers
Topic Video
Question
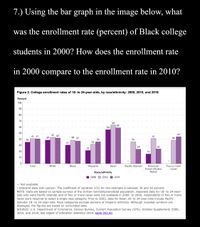
Using the bar graph in the image below, what was the enrollment rate (percent) of Black college students in 2000? How does the enrollment rate in 2000 compare to the enrollment rate in 2010?

Transcribed Image Text:7.) Using the bar graph in the image below, what
was the enrollment rate (percent) of Black college
students in 2000? How does the enrollment rate
in 2000 compare to the enrollment rate in 2010?
Figure 2. College enrollment rates of 18- to 24-year-olds, by racelethnicity: 2000, 2010, and 2018
Percent
100
90
80
70
64
59
60
56
50
44
43 42
39
41 41
41
38 37
38
40
36
32
35
36
31
30
24!
24
22
20
16
10
Total
White
Black
Hispanic
Asian
Pacific Islander
Two or more
American
Indian/Alaska
Native
races
Race/ethnicity
2000 O 2010
2018
- Not available.
! Interpret data with caution. The coefficient of variation (CV) for this estimate is between 30 and 50 percent.
NOTE: Data are based on sample surveys of the civilian noninstitutionalized population. Separate data for 18- to 24-year-
olds who were Pacific Islander and of Two or more races were not available in 2000. In 2000, respondents of Two or more
races were required to select a single race category. Prior to 2003, data for Asian 18- to 24-year-olds include Pacific
Islander 18- to 24-year-olds. Race categories exclude persons of Hispanic ethnicity. Although rounded numbers are
displayed, the figures are based on unrounded data.
SOURCE: U.S. Department of Commerce, Census Bureau, Current Population Survey (CPS), October Supplement, 2000,
2010, and 2018. See Digest of Education Statistics 2019, table 302.60.
Expert Solution
This question has been solved!
Explore an expertly crafted, step-by-step solution for a thorough understanding of key concepts.
This is a popular solution
Trending nowThis is a popular solution!
Step by stepSolved in 2 steps with 1 images

Knowledge Booster
Learn more about
Need a deep-dive on the concept behind this application? Look no further. Learn more about this topic, statistics and related others by exploring similar questions and additional content below.Similar questions
- Last year a professional basketball team won 60 games. This year the team won 9 fewer games than it won last year. What is the percent decreasee in the number of games the team won?arrow_forwardThe American Booksellers Association, which represents independent booksellers, includes 1500 businesses at 2500 locations. Twenty years ago it represented 4700 businesses at 5500 locations; what is the percent change in the number of businesses and locations represented?arrow_forwardIn a soccer game Tasha made 3 out of 15 shots on goal. What percent of shots did she make?arrow_forward
arrow_back_ios
arrow_forward_ios
Recommended textbooks for you
 MATLAB: An Introduction with ApplicationsStatisticsISBN:9781119256830Author:Amos GilatPublisher:John Wiley & Sons Inc
 Probability and Statistics for Engineering and th...StatisticsISBN:9781305251809Author:Jay L. DevorePublisher:Cengage Learning
 Statistics for The Behavioral Sciences (MindTap C...StatisticsISBN:9781305504912Author:Frederick J Gravetter, Larry B. WallnauPublisher:Cengage Learning
 Elementary Statistics: Picturing the World (7th E...StatisticsISBN:9780134683416Author:Ron Larson, Betsy FarberPublisher:PEARSON
 The Basic Practice of StatisticsStatisticsISBN:9781319042578Author:David S. Moore, William I. Notz, Michael A. FlignerPublisher:W. H. Freeman
 Introduction to the Practice of StatisticsStatisticsISBN:9781319013387Author:David S. Moore, George P. McCabe, Bruce A. CraigPublisher:W. H. Freeman

MATLAB: An Introduction with Applications
Statistics
ISBN:9781119256830
Author:Amos Gilat
Publisher:John Wiley & Sons Inc

Probability and Statistics for Engineering and th...
Statistics
ISBN:9781305251809
Author:Jay L. Devore
Publisher:Cengage Learning

Statistics for The Behavioral Sciences (MindTap C...
Statistics
ISBN:9781305504912
Author:Frederick J Gravetter, Larry B. Wallnau
Publisher:Cengage Learning

Elementary Statistics: Picturing the World (7th E...
Statistics
ISBN:9780134683416
Author:Ron Larson, Betsy Farber
Publisher:PEARSON

The Basic Practice of Statistics
Statistics
ISBN:9781319042578
Author:David S. Moore, William I. Notz, Michael A. Fligner
Publisher:W. H. Freeman

Introduction to the Practice of Statistics
Statistics
ISBN:9781319013387
Author:David S. Moore, George P. McCabe, Bruce A. Craig
Publisher:W. H. Freeman