
A First Course in Probability (10th Edition)
10th Edition
ISBN: 9780134753119
Author: Sheldon Ross
Publisher: PEARSON
expand_more
expand_more
format_list_bulleted
Related questions
Question
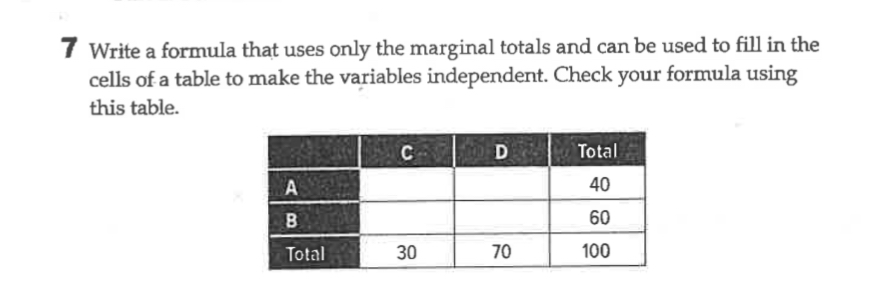

Transcribed Image Text:7 Write a formula that uses only the marginal totals and can be used to fill in the
cells of a table to make the variables independent. Check your formula using
this table.
A
B
Total
C
30
D Total
40
60
100
70
Expert Solution
This question has been solved!
Explore an expertly crafted, step-by-step solution for a thorough understanding of key concepts.

Step by stepSolved in 2 steps

Knowledge Booster

Similar questions
- The boxplot below shows salaries for Construction workers and Teachers. Construction Teacher 20 25 30 35 40 45 50 Salary (thousands of S) If a person is making the maximum salary for a construction worker, they are making more than what percentage of Teachers?arrow_forwardDuring 10 weeks, a dealership recorded the number of TV ads (x variable) and the number of cars sold (y variable). The results are given in the following table. X 6 20 0 14 25 16 28 18 10 8 Y 15 31 10 16 28 20 40 25 12 15 Please asnwer questions on picture thank youarrow_forwardSuppose classmates who graduated in 2004 compared their median incomes ten years later. The bar graph displays the median income, in thousands of dollars, for each classmate during the time intervals from 60 43 38 2005-2009 and 2010-2014. 35 35 For the individual with the largest dollar value increase 30 in median income over the two time intervals, 20 determine the amount of increase. Martina Roger Scott Becky Yronne Classmates 2005 - 2009 2010 - 2014 By what percentage did Roger's median income decrease over the two time intervals? Give your answer to the nearest percent. Percentage: % Median income (thousands of dollars)arrow_forward
- The data in the table is the number of absences for 5 students and their corresponding grade. Number of Absences 5 8 Grade 90 78 Calculate the coefficient of determination, R2. Round your answer to three decimal places. Answer How to enter your answer (opens in new window) 9 10 11 74 62 58arrow_forwardThe graph below shows the U.S. federal expenses for 2012. 3000- Interest All other departments and agencies Dollars (billions) 2000- 1000- Department of Defense Medicaid Medicare Other Social Security Mandatory spending Discretionary spending (a) Estimate the fraction of the total expenses that were spent on Medicare. Write your answer as the closest fraction whose denominator is 100. 100 000 00 100 100 100 100 (b) Estimate the fraction of the total expenses that were spent on Medicare and Medicaid. Write your answer as the closest fraction whose denominator is 100. 10 00000 100 20 100 30 100 40 100 100arrow_forward14. Forest Fires and Acres Burned An environmentalist wants to determine the relationships between the numbers (in thousands) of forest fires over the year and the number (in hundred thousands) of acres burned. The data for 8 recent years are shown. Describe the relationship. Number of fires x 72 69 58 47 84 62 57 45 Number of acres burned y 62 42 19 26 51 15 30 15arrow_forward
arrow_back_ios
arrow_forward_ios
Recommended textbooks for you
- A First Course in Probability (10th Edition)ProbabilityISBN:9780134753119Author:Sheldon RossPublisher:PEARSON

A First Course in Probability (10th Edition)
Probability
ISBN:9780134753119
Author:Sheldon Ross
Publisher:PEARSON