
MATLAB: An Introduction with Applications
6th Edition
ISBN: 9781119256830
Author: Amos Gilat
Publisher: John Wiley & Sons Inc
expand_more
expand_more
format_list_bulleted
Related questions
Question
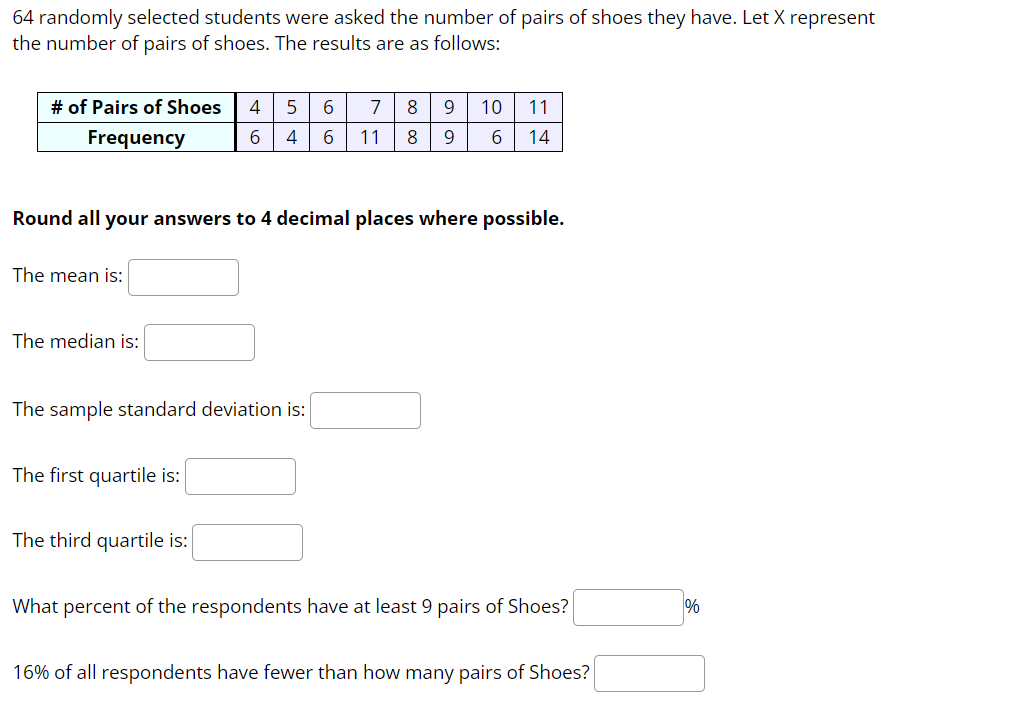

Transcribed Image Text:64 randomly selected students were asked the number of pairs of shoes they have. Let X represent
the number of pairs of shoes. The results are as follows:
# of Pairs of Shoes
4
5
6
7
8
9
10 11
Frequency
6
4
6
11
8
9
6
14
Round all your answers to 4 decimal places where possible.
The mean is:
The median is:
The sample standard deviation is:
The first quartile is:
The third quartile is:
What percent of the respondents have at least 9 pairs of Shoes?
16% of all respondents have fewer than how many pairs of Shoes?
%
Expert Solution
This question has been solved!
Explore an expertly crafted, step-by-step solution for a thorough understanding of key concepts.

Step by stepSolved in 2 steps with 3 images

Knowledge Booster

Similar questions
- Not yet answered Marked out of 1.00 P Flag question T01 people were interviewed and were asked about the number of bicycles that they had in their hou The results are shown in the table below: Number of Bicycles Frequency 15 1 30 20 3. 15 15 6. What is the median of this set of data? Select one: a. b. 4 OC 3 d. O d. 1 Previous page 4.arrow_forwardWhich of the following are measures on positions of a data set? the maximum the standard deviation the third quartile a standard score the medianarrow_forwardThe instructor takes a random sample of size from the population data and obtains the following sample data: x 405 385 495 385 555 470 8 The sample standard deviation is, a 69.17 b 66.51 c 63.14 d 61.49arrow_forward
- The average weekly incomes, in £s, of 18 selected occupations in the United Kingdom were: 244, 146, 278, 396, 435, 641, 577, 122, 294 357, 802 730, 286, 484, 169,, 559, 208, 498 Find the median, mode, variance, range, mad, upper extreme, lower extreme. Draw a box plot to represent these incomes. Calculate the mean weekly income and the standard deviation. (HANDWRITTEN OR AT LEAST NOT IN A CODE FORM)arrow_forward17arrow_forwardThe table below shows the scores of a group of students on a 10-point quiz. Test Score Frequency 3 1 4 1 7 4 8 4 9. 10 2 The mean score on this test is: The median score on this test is: Check Answerarrow_forward
- I vacuum cleaners. The weights are classified according to vacuum cleaner type. At a=0.10, can you conclude that at least one mean vacuum cleaner weight is different The table available below shows the weights (in pounds) for a sample from the others? E Click the icon to view the vacuum cleaner weight data. Let Hgu. PBLU and PTC represent the mean weights for bagged upright, bagless upright, and top canister vacuums respectively. What are the hypotheses for this test? O A. Ho: Heu * PBLU HTC H PBU PBLU =HTC Weight of Vacuum Cleaners by Type O B. Ho: At least one of the means is different. H PBu = HBLUu =PTC &c. Họ: PBU = HBLU =HTC Bagged upright 22 19 Bagless upright Top canister 21 22 23 25 H: At least one of the means different. 17 20 15 18 18 19 O D. Ho: PBU = PBLU "HTC 23 20 26 25 22| 23 Ha: Peu * PBLU *HTC What is the test statistic? Print Done F= (Round to two decimal places as needed.)arrow_forwardSuppose six pet food stores in the area were surveyed, and the following data shows how many types of pet food each of them carries. 7,7,9, 9, 11, 11 Calculate the sample mean and the sample standard deviation. Round your answers to three decimal places. T = Number Number S=arrow_forward
arrow_back_ios
arrow_forward_ios
Recommended textbooks for you
- MATLAB: An Introduction with ApplicationsStatisticsISBN:9781119256830Author:Amos GilatPublisher:John Wiley & Sons Inc
 Probability and Statistics for Engineering and th...StatisticsISBN:9781305251809Author:Jay L. DevorePublisher:Cengage Learning
 Statistics for The Behavioral Sciences (MindTap C...StatisticsISBN:9781305504912Author:Frederick J Gravetter, Larry B. WallnauPublisher:Cengage Learning
  Elementary Statistics: Picturing the World (7th E...StatisticsISBN:9780134683416Author:Ron Larson, Betsy FarberPublisher:PEARSON
 The Basic Practice of StatisticsStatisticsISBN:9781319042578Author:David S. Moore, William I. Notz, Michael A. FlignerPublisher:W. H. Freeman
 Introduction to the Practice of StatisticsStatisticsISBN:9781319013387Author:David S. Moore, George P. McCabe, Bruce A. CraigPublisher:W. H. Freeman
MATLAB: An Introduction with Applications
Statistics
ISBN:9781119256830
Author:Amos Gilat
Publisher:John Wiley & Sons Inc
Probability and Statistics for Engineering and th...
Statistics
ISBN:9781305251809
Author:Jay L. Devore
Publisher:Cengage Learning
Statistics for The Behavioral Sciences (MindTap C...
Statistics
ISBN:9781305504912
Author:Frederick J Gravetter, Larry B. Wallnau
Publisher:Cengage Learning
Elementary Statistics: Picturing the World (7th E...
Statistics
ISBN:9780134683416
Author:Ron Larson, Betsy Farber
Publisher:PEARSON
The Basic Practice of Statistics
Statistics
ISBN:9781319042578
Author:David S. Moore, William I. Notz, Michael A. Fligner
Publisher:W. H. Freeman
Introduction to the Practice of Statistics
Statistics
ISBN:9781319013387
Author:David S. Moore, George P. McCabe, Bruce A. Craig
Publisher:W. H. Freeman