MATLAB: An Introduction with Applications
6th Edition
ISBN: 9781119256830
Author: Amos Gilat
Publisher: John Wiley & Sons Inc
expand_more
expand_more
format_list_bulleted
Question

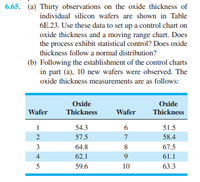
Transcribed Image Text:6.65. (a) Thirty observations on the oxide thickness of
individual silicon wafers are shown in Table
6E.23. Use these data to set up a control chart on
oxide thickness and a moving range chart. Does
the process exhibit statistical control? Does oxide
thickness follow a normal distribution?
(b) Following the establishment of the control charts
in part (a), 10 new wafers were observed. The
oxide thickness measurements are as follows:
Oxide
Oxide
Wafer
Thickness
Wafer
Thickness
1
54.3
6.
51.5
2
57.5
7
58.4
3
64.8
8
67.5
4
62.1
61.1
5
59.6
10
63.3

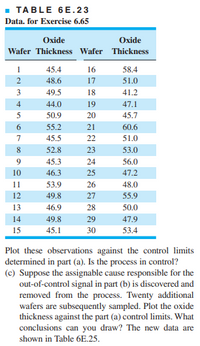
Transcribed Image Text:- TABLE 6E.23
Data. for Exercise 6.65
Oxide
Oxide
Wafer Thickness Wafer Thickness
45.4
16
58.4
2
48.6
17
51.0
3
49.5
18
41.2
4
44.0
19
47.1
5
50.9
20
45.7
55.2
21
60.6
45.5
22
51.0
52.8
23
53.0
45.3
24
56.0
10
46.3
25
47.2
11
53.9
26
48.0
12
49.8
27
55.9
13
46.9
28
50.0
14
49.8
29
47.9
15
45.1
30
53.4
Plot these observations against the control limits
determined in part (a). Is the process in control?
(c) Suppose the assignable cause responsible for the
out-of-control signal in part (b) is discovered and
removed from the process. Twenty additional
wafers are subsequently sampled. Plot the oxide
thickness against the part (a) control limits. What
conclusions can you draw? The new data are
shown in Table 6E.25.
6700
Expert Solution
This question has been solved!
Explore an expertly crafted, step-by-step solution for a thorough understanding of key concepts.
This is a popular solution
Trending nowThis is a popular solution!
Step by stepSolved in 2 steps with 2 images

Knowledge Booster
Similar questions
- Need help asap pls!!arrow_forward1. A study of the relation between the waistline and percent body fat in men yielded the data shown (waistline measurement in inches). waistline (x) 34.7 46.5 32.8 41.3 29.8 39.3 35.7 29.0 percent fat (y) 21.8 33.6 13.4 27.1 13.7 30.2 18.5 11.2 x = 36.1375 y = 21.1875 SSxx = 248.53875 SSay = 332.67375 SSyy = 494.30875 (a) Find the proportion of the variability in percent body fat that is accounted for by the size of the waistline. Explain fully. (b) Find the regression line for predicting y from x. (c) Construct a 95% confidence interval for the average percent body fat of all men whose waistline size is 34.0 inches. (d) test HO: Beta1 is 0 vs. Ha : Beta1 is not 0, compute the appropriate test statistic and p-value, then make your decision at a = 0.05. (e) Construct a 90% confidence interval for beta1. (f) Compute a 90% confidence interval for the average percent fat when waistline is 35.arrow_forward6. Setup: JP was curious about the sodium content of organic cornflakes. To investigate this, twenty 300-gram boxes of organic cornflakes were obtained and the sodium content was measured. The data (in milligrams) are as follows: 131.1, 130.7, 130.9, 129.5, 129.6, 128.8, 130.7, 128.3, 128.2, 129.7, 130.1, 129.3, 128.7, 129.0, 129.4, 130.4, 129.5, 130.1, 129.8, 130.0 Task: Perform a hypothesis test using R to determine if you can support a claim that the mean sodium content of this brand of cornflakes differs from 130 milligrams? Use a = 0.08 to make your decision. R Output: Upon running your analysis in R, you obtain the following results: One Sample t-test data: corn = 0.1121 t = -1.6659, df = alternative hypothesis: true mean is not equal to 130 19, р-value 92 percent confidence interval: 129.3458 130.0342 sample estimates: mean of x 129.69 Questions: (a) State the hypotheses used in performing this test. (b) Using the output above, state the decision (Reject or Not Reject Ho) of the…arrow_forward
- 1. The data in Table 7–6 were collected in a clinical trial to evaluate a new compound designed to improve wound healing in trauma patients. The new compound was com- pared against a placebo. After treatment for 5 days with the new compound or placebo, the extent of wound healing was measured. Is there a difference in the extent of wound healing between the treatments? (Hint: Are treatment and the percent wound healing independent?) Run the appropriate test at a 5% level of significance. Use the data in Problem 1. Pool the data across the treatments into one sample of size n = 250. Use the pooled data to test whether the distribution of the percent wound healing is approximately normal. Specifically, use the following distribution 30%, 40%, 20%, and 10% and a = 0.05 to run the appropriate test. Percent Wound Healing Treatment 0-25% 26-50% 51-75% 76-100% New compound (n=125) 15 37 32 41 Placebo (n=125) 36 45 34 10arrow_forward1. SUGAR Listed below are measured weights (mg) of sugar in Domino packets labelled as containing 3500 mg (or 3.5 g). Are the data qualitative or quantitative? What is the level of measurement of the data (nominal, ordinal, interval, or ratio)? Before any rounding, are the weights discrete or continuous? Given that the weights are from Domino sugar packets selected from a much larger population, are the weights a sample or a population? If we calculate the mean of the listed values, is the result a statistic or a parameter? 3511 3516 3521 3531 3532 3545 3583 3588 3590 3617 3621 3635 3638 3643 3645 3647 3666 3673 3678 3723 2. FREQUENCY DISTRIBUTION Using the data from Exercise 1, construct a frequency distribution using a class width of 50 mg and a first class with a lower class limit of 3500 mg. 3. HISTOGRAM Use the frequency distribution from Exercise 2 to construct a histogram. Use class midpoint values for the horizontal scale.arrow_forward
arrow_back_ios
arrow_forward_ios
Recommended textbooks for you
 MATLAB: An Introduction with ApplicationsStatisticsISBN:9781119256830Author:Amos GilatPublisher:John Wiley & Sons Inc
 Probability and Statistics for Engineering and th...StatisticsISBN:9781305251809Author:Jay L. DevorePublisher:Cengage Learning
 Statistics for The Behavioral Sciences (MindTap C...StatisticsISBN:9781305504912Author:Frederick J Gravetter, Larry B. WallnauPublisher:Cengage Learning
 Elementary Statistics: Picturing the World (7th E...StatisticsISBN:9780134683416Author:Ron Larson, Betsy FarberPublisher:PEARSON
 The Basic Practice of StatisticsStatisticsISBN:9781319042578Author:David S. Moore, William I. Notz, Michael A. FlignerPublisher:W. H. Freeman
 Introduction to the Practice of StatisticsStatisticsISBN:9781319013387Author:David S. Moore, George P. McCabe, Bruce A. CraigPublisher:W. H. Freeman

MATLAB: An Introduction with Applications
Statistics
ISBN:9781119256830
Author:Amos Gilat
Publisher:John Wiley & Sons Inc

Probability and Statistics for Engineering and th...
Statistics
ISBN:9781305251809
Author:Jay L. Devore
Publisher:Cengage Learning

Statistics for The Behavioral Sciences (MindTap C...
Statistics
ISBN:9781305504912
Author:Frederick J Gravetter, Larry B. Wallnau
Publisher:Cengage Learning

Elementary Statistics: Picturing the World (7th E...
Statistics
ISBN:9780134683416
Author:Ron Larson, Betsy Farber
Publisher:PEARSON

The Basic Practice of Statistics
Statistics
ISBN:9781319042578
Author:David S. Moore, William I. Notz, Michael A. Fligner
Publisher:W. H. Freeman

Introduction to the Practice of Statistics
Statistics
ISBN:9781319013387
Author:David S. Moore, George P. McCabe, Bruce A. Craig
Publisher:W. H. Freeman