
MATLAB: An Introduction with Applications
6th Edition
ISBN: 9781119256830
Author: Amos Gilat
Publisher: John Wiley & Sons Inc
expand_more
expand_more
format_list_bulleted
Related questions
Question
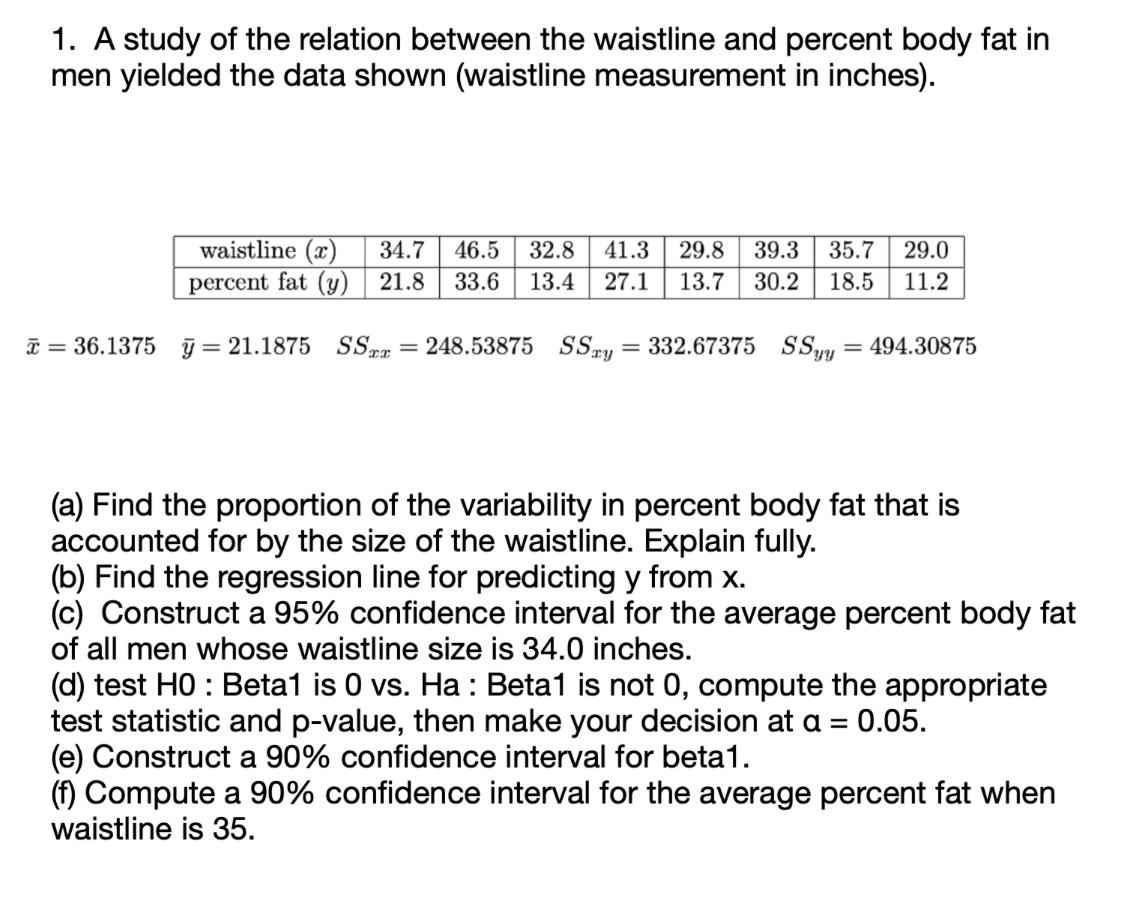

Transcribed Image Text:1. A study of the relation between the waistline and percent body fat in
men yielded the data shown (waistline measurement in inches).
waistline (x) 34.7 46.5 32.8 41.3 29.8 39.3 35.7 29.0
percent fat (y) 21.8 33.6 13.4 27.1 13.7 30.2 18.5 11.2
x = 36.1375 y = 21.1875 SSxx = 248.53875 SSay = 332.67375 SSyy = 494.30875
(a) Find the proportion of the variability in percent body fat that is
accounted for by the size of the waistline. Explain fully.
(b) Find the regression line for predicting y from x.
(c) Construct a 95% confidence interval for the average percent body fat
of all men whose waistline size is 34.0 inches.
(d) test HO: Beta1 is 0 vs. Ha : Beta1 is not 0, compute the appropriate
test statistic and p-value, then make your decision at a = 0.05.
(e) Construct a 90% confidence interval for beta1.
(f) Compute a 90% confidence interval for the average percent fat when
waistline is 35.
Expert Solution
This question has been solved!
Explore an expertly crafted, step-by-step solution for a thorough understanding of key concepts.

This is a popular solution

Trending nowThis is a popular solution!

Step by stepSolved in 4 steps with 3 images

Knowledge Booster

Similar questions
- Please answer the following question below given the data and question instructions. Answer all parts!! And explain how you created the grpahs, got the results. Thank you.arrow_forwardExplain the meaning of the following percentiles in parts (a) and (b). Qu (a) The 10th percentile of the weight of males 36 months of age in a certain city is 110 kg. (b) The 95th percentile of the length of newborn females in a certain city is 53.8 cm. (a) Choose the correct answer below. O A. 10% of 36-month-old males weigh 11.0 kg or less, and 90% of 36-month-old males weigh more than 11.0 kg. O B. 10% of 36-month-old males weigh 11.0 kg or more, and 90% of 36-month-old males weigh less than 11.0 kg. O C. 10% of males weigh 11.0 kg or more, and 90% of 36-month-old males weigh less than 11.0 kg. O D. 10% of males weigh 11.0 kg or less, and 90% of 36-month-old males weigh more than 11.0 kg. (b) Choose the correct answer below. O A. 95% of newborn females have a length of 53.8 cm or less, and 5% of newborn females have a length that is more than 53.8 cm. O B. 95% of newborn females have a length of 53.8 cm or more, and 5% of newborn females have a length that is less than 53.8 cm. O C.…arrow_forward2. Which measures of central tendency can be used for the variable below? Explain why each of the three measures of central tendency is or is not applicable. Answer Here: How closely do you follow the news about current events? Would you say... Cumulative Frequency Percent Valid Percent Percent Valid Most of the time 1128 41.9 41.9 41.9 some of the time 1304 48.4 48.5 90.4 rarely 239 8.9 8.9 99.3 never 19 .7 .7 100.0 Total 2690 99.9 100.0 Missing Don't Know/Refused (DON'T READ) 2 .1arrow_forward
- Determine the point of estimate of the population mean and margin of error from the given information: Lower Bound: 5 Upper Bound: 23 Question 4 options: x¯= 15 E = 10 x¯= 12 E = 9 x¯= 13.5 E = 9 x¯= 14 E = 9arrow_forwardDraw the normal curve using the data given b. x = 83. s = 6 a.x = 30. s = 8 %3Darrow_forwardExplain the meaning of the accompanying percentiles. (a) The 5th percentile of the head circumference of males 3 to 5 months of age in a certain city is 41.5 cm. (b) The 95th percentile of the waist circumference of females 2 years of age in a certain city is 49.8 cm. (c) Anthropometry involves the measurement of the human body. One goal of these measurements is to assess how body measurements may be changing over time. The following table represents the standing height of males aged 20 years or older for various age groups in a certain city in 2015. Based on the percentile measurements of the different age groups, what might you conclude?arrow_forward
arrow_back_ios
arrow_forward_ios
Recommended textbooks for you
- MATLAB: An Introduction with ApplicationsStatisticsISBN:9781119256830Author:Amos GilatPublisher:John Wiley & Sons Inc
 Probability and Statistics for Engineering and th...StatisticsISBN:9781305251809Author:Jay L. DevorePublisher:Cengage Learning
 Statistics for The Behavioral Sciences (MindTap C...StatisticsISBN:9781305504912Author:Frederick J Gravetter, Larry B. WallnauPublisher:Cengage Learning
  Elementary Statistics: Picturing the World (7th E...StatisticsISBN:9780134683416Author:Ron Larson, Betsy FarberPublisher:PEARSON
 The Basic Practice of StatisticsStatisticsISBN:9781319042578Author:David S. Moore, William I. Notz, Michael A. FlignerPublisher:W. H. Freeman
 Introduction to the Practice of StatisticsStatisticsISBN:9781319013387Author:David S. Moore, George P. McCabe, Bruce A. CraigPublisher:W. H. Freeman
MATLAB: An Introduction with Applications
Statistics
ISBN:9781119256830
Author:Amos Gilat
Publisher:John Wiley & Sons Inc
Probability and Statistics for Engineering and th...
Statistics
ISBN:9781305251809
Author:Jay L. Devore
Publisher:Cengage Learning
Statistics for The Behavioral Sciences (MindTap C...
Statistics
ISBN:9781305504912
Author:Frederick J Gravetter, Larry B. Wallnau
Publisher:Cengage Learning
Elementary Statistics: Picturing the World (7th E...
Statistics
ISBN:9780134683416
Author:Ron Larson, Betsy Farber
Publisher:PEARSON
The Basic Practice of Statistics
Statistics
ISBN:9781319042578
Author:David S. Moore, William I. Notz, Michael A. Fligner
Publisher:W. H. Freeman
Introduction to the Practice of Statistics
Statistics
ISBN:9781319013387
Author:David S. Moore, George P. McCabe, Bruce A. Craig
Publisher:W. H. Freeman