
MATLAB: An Introduction with Applications
6th Edition
ISBN: 9781119256830
Author: Amos Gilat
Publisher: John Wiley & Sons Inc
expand_more
expand_more
format_list_bulleted
Related questions
Concept explainers
Topic Video
Question
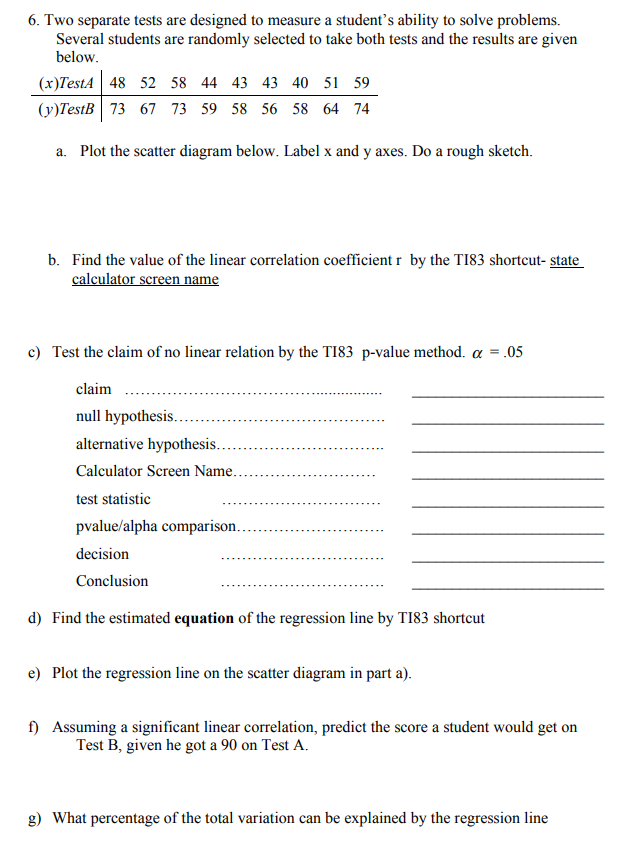

Transcribed Image Text:6. Two separate tests are designed to measure a student's ability to solve problems.
Several students are randomly selected to take both tests and the results are given
below.
(x)TestA 48 52 58 44 43 43 40 51 59
(y)TestB| 73 67 73 59 58 56 58 64 74
a. Plot the scatter diagram below. Label x and y axes. Do a rough sketch.
b. Find the value of the linear correlation coefficient r by the TI83 shortcut- state
calculator screen name
c) Test the claim of no linear relation by the TI83 p-value method. a
.05
claim
null hypothesis.
alternative hypothesis...
Calculator Screen Name.....
test statistic
pvalue/alpha comparison.…....
decision
Conclusion
d) Find the estimated equation of the regression line by T183 shortcut
e) Plot the regression line on the scatter diagram in part a).
f) Assuming a significant linear correlation, predict the score a student would get on
Test B, given he got a 90 on Test A.
g) What percentage of the total variation can be explained by the regression line
Expert Solution
This question has been solved!
Explore an expertly crafted, step-by-step solution for a thorough understanding of key concepts.

This is a popular solution

Trending nowThis is a popular solution!

Step by stepSolved in 7 steps with 8 images

Knowledge Booster


Learn more about
Need a deep-dive on the concept behind this application? Look no further. Learn more about this topic, statistics and related others by exploring similar questions and additional content below.Similar questions
- Listed below are the budgets (in millions of dollars) and the gross receipts (in millions of dollars) for randomly selected movies. Answer parts a-c. Budget (x) Gross (y)60 6091 6050 4839 62193 558105 14087 52 a. Find the value of the linear correlation coefficient r.arrow_forwardLet x be the average number of employees in a group health insurance plan, and let y be the average administrative cost as a percentage of claims. x 3 7 15 32 75 y 40 35 30 26 18 (a) Make a scatter diagram of the data and visualize the line you think best fits the data. Flash Player version 10 or higher is required for this question. You can get Flash Player free from Adobe's website. (b) Would you say the correlation is low, moderate, or strong? positive or negative? strong and negative moderate and negative strong and positive low and negative low and positive moderate and positive (c) Use a calculator to verify that Σx = 132, Σx2 = 6932, Σy = 149, Σy2 = 4725, and Σxy = 2997. Compute r. (Round your answer to three decimal places.)r = As x increases, does the value of r imply that y should tend to increase or decrease? Explain. Given our value of r, we cannot draw any conclusions for the behavior of y as x increases. Given our value of r, y should tend to…arrow_forward3. The speed (in miles per hour) of 8 vehicles and their braking distance (in feet) when stopping on a dry surface speed, x braking distance, y 20 30 40 50 50 60 65 70 55 72 75 110 138 162 193 225 type of correlation: Conclusionarrow_forward
- The numbers of pass attempts and passing yards for seven professional quarterback for a recent year are listed in the table below. Round all answers to the nearest 1000th. Pass attempts (x) 449 565 528 197 670 351 218 Passing Yards (y) 3265 4018 3669 1141 5177 2362 1737 Calculate the sample correlation coefficient, r. Describe the type of correlation coefficient and interpret the correlation in the context of the data. Find the equation of the regression line for the data. Use the regression equation to predict the average number passing yards if the pass attempts are 250.arrow_forwardThe data below is 12 observations of Math SAT scores (x) and scores on Math placement test (y). Calculate the linear correlation coefficient, rr. Enter your answers to two decimal places. X Y 420 426 410 360 600 575 460 538 550 553 480 407 560 635 450 388 400 383 430 402 470 462 440 437 rr =arrow_forwardUse the data in the table, which shows the average annual salaries (both in thousands of dollars) for public school principals and teachers in the U.S. for 11 years. Apply what you have learned in the previous tab to complete this graded lab questions. 1. Repeat the steps from tab #1 using this data to construct a scatter plot graph and calculate the correlation coefficient R. (Recall the corelation coefficient is R and not R Teachers y Principalsx 77.8 43.7 78.4 43.8 80.8 45.0 R= 80.5 45.6, 2. Does the R value represent a positive, negative or no correlation between the salaries ol the teachers and principals? As teacher salaries increase, what happens to prinicipal salaries? 10 11 81.5 45.9 84.8 48.2 12 13 87.7 49,3 3. Write the equation of the regression line for the data below. The equation is y= 14 91.6 51.3 52.9 Teachers y 15 16 95.7 54.4 COD 54.2 =D0.5873x-2.0s07o R=0.995, 17 95.7 4. Use the regression equation that you found in exercise #3 to predict the average annual salary…arrow_forward
- A local store kept track of the number of advertisements it placed in local newspapers and the number of stereo systems it sold each week. Week 1 2 3 4 5 6 7 8 Advertisements, x 7 5 4 2 8 5 5 3 Stereos Sold, y 23 15 12 8 2 7 9 6 a) Create a scatter plot for the data showing Advertisements Vs. Stereos Sold. b) Determine the value of r, the correlation coefficient for the set of data and classify the type of correlation. c) What does this correlation coefficient suggest about the effectiveness of the advertisements? Explainarrow_forwardPlease help!arrow_forward
arrow_back_ios
arrow_forward_ios
Recommended textbooks for you
- MATLAB: An Introduction with ApplicationsStatisticsISBN:9781119256830Author:Amos GilatPublisher:John Wiley & Sons Inc
 Probability and Statistics for Engineering and th...StatisticsISBN:9781305251809Author:Jay L. DevorePublisher:Cengage Learning
 Statistics for The Behavioral Sciences (MindTap C...StatisticsISBN:9781305504912Author:Frederick J Gravetter, Larry B. WallnauPublisher:Cengage Learning
  Elementary Statistics: Picturing the World (7th E...StatisticsISBN:9780134683416Author:Ron Larson, Betsy FarberPublisher:PEARSON
 The Basic Practice of StatisticsStatisticsISBN:9781319042578Author:David S. Moore, William I. Notz, Michael A. FlignerPublisher:W. H. Freeman
 Introduction to the Practice of StatisticsStatisticsISBN:9781319013387Author:David S. Moore, George P. McCabe, Bruce A. CraigPublisher:W. H. Freeman
MATLAB: An Introduction with Applications
Statistics
ISBN:9781119256830
Author:Amos Gilat
Publisher:John Wiley & Sons Inc
Probability and Statistics for Engineering and th...
Statistics
ISBN:9781305251809
Author:Jay L. Devore
Publisher:Cengage Learning
Statistics for The Behavioral Sciences (MindTap C...
Statistics
ISBN:9781305504912
Author:Frederick J Gravetter, Larry B. Wallnau
Publisher:Cengage Learning
Elementary Statistics: Picturing the World (7th E...
Statistics
ISBN:9780134683416
Author:Ron Larson, Betsy Farber
Publisher:PEARSON
The Basic Practice of Statistics
Statistics
ISBN:9781319042578
Author:David S. Moore, William I. Notz, Michael A. Fligner
Publisher:W. H. Freeman
Introduction to the Practice of Statistics
Statistics
ISBN:9781319013387
Author:David S. Moore, George P. McCabe, Bruce A. Craig
Publisher:W. H. Freeman