MATLAB: An Introduction with Applications
6th Edition
ISBN: 9781119256830
Author: Amos Gilat
Publisher: John Wiley & Sons Inc
expand_more
expand_more
format_list_bulleted
Question
I keep getting the wrong answers and am trying to figure out where I am making a mistake. Please show me the steps in detail so I can see the right way to solve this equation.

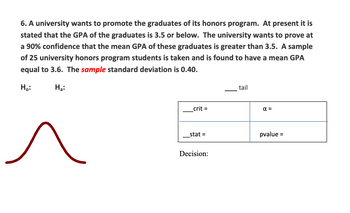
Transcribed Image Text:**Hypothesis Testing for University Honors Program Graduates**
A university aims to highlight the achievements of its honors program graduates. Currently, the graduates have an average GPA of 3.5 or below. The university seeks to demonstrate, with 90% confidence, that the mean GPA exceeds 3.5. A sample of 25 students from the honors program reveals a mean GPA of 3.6, with a sample standard deviation of 0.40.
**Null Hypothesis (H₀):**
The mean GPA of the graduates is 3.5 or lower.
**Alternative Hypothesis (Hₐ):**
The mean GPA of the graduates is greater than 3.5.
The diagram includes:
1. **Bell Curve:**
- Illustrates the distribution of GPAs. Evaluation focuses on the right-tail for testing whether the mean GPA exceeds 3.5.
2. **Table for Statistical Values:**
- **_crit =**: Critical value.
- **α =**: Significance level (alpha).
- **_stat =**: Test statistic.
- **p-value =**: Probability value.
**Decision:**
- Based on the p-value and comparison with α, conclude whether to reject or fail to reject the null hypothesis.
Expert Solution
This question has been solved!
Explore an expertly crafted, step-by-step solution for a thorough understanding of key concepts.
This is a popular solution
Trending nowThis is a popular solution!
Step by stepSolved in 3 steps with 3 images

Knowledge Booster
Similar questions
- This question has several parts that must be completed sequentially. If you skip a part of the question, you will not receive any points for the skipped part, and you will not be able to come back to the skipped part. A person's lean body weight L is the amount he or she would weigh if all body fat were magically to disappear. One text gives the "equation that practitioners can use most feasibly in the field to predict lean body weight in young adult males." The equation is found below. L = 98.42 + 1.08W − 4.14A Here L is lean body weight in pounds, W is weight in pounds, and A is abdominal circumference in inches. Find the approximate lean body weight of a young adult male who weighs 181 pounds and has an abdominal circumference of 41 inches. What is the weight of his body fat? What is his body fat percent?arrow_forwardI don't understand how to solve this problem, can you help me? the problem is 15 -6x for x=2.5arrow_forwardThe homework problem asks for this to be plugged into the graphing calculator to solve for a approximate solutions for the equation, which i don't know how to do.arrow_forward
arrow_back_ios
arrow_forward_ios
Recommended textbooks for you
 MATLAB: An Introduction with ApplicationsStatisticsISBN:9781119256830Author:Amos GilatPublisher:John Wiley & Sons Inc
 Probability and Statistics for Engineering and th...StatisticsISBN:9781305251809Author:Jay L. DevorePublisher:Cengage Learning
 Statistics for The Behavioral Sciences (MindTap C...StatisticsISBN:9781305504912Author:Frederick J Gravetter, Larry B. WallnauPublisher:Cengage Learning
 Elementary Statistics: Picturing the World (7th E...StatisticsISBN:9780134683416Author:Ron Larson, Betsy FarberPublisher:PEARSON
 The Basic Practice of StatisticsStatisticsISBN:9781319042578Author:David S. Moore, William I. Notz, Michael A. FlignerPublisher:W. H. Freeman
 Introduction to the Practice of StatisticsStatisticsISBN:9781319013387Author:David S. Moore, George P. McCabe, Bruce A. CraigPublisher:W. H. Freeman

MATLAB: An Introduction with Applications
Statistics
ISBN:9781119256830
Author:Amos Gilat
Publisher:John Wiley & Sons Inc

Probability and Statistics for Engineering and th...
Statistics
ISBN:9781305251809
Author:Jay L. Devore
Publisher:Cengage Learning

Statistics for The Behavioral Sciences (MindTap C...
Statistics
ISBN:9781305504912
Author:Frederick J Gravetter, Larry B. Wallnau
Publisher:Cengage Learning

Elementary Statistics: Picturing the World (7th E...
Statistics
ISBN:9780134683416
Author:Ron Larson, Betsy Farber
Publisher:PEARSON

The Basic Practice of Statistics
Statistics
ISBN:9781319042578
Author:David S. Moore, William I. Notz, Michael A. Fligner
Publisher:W. H. Freeman

Introduction to the Practice of Statistics
Statistics
ISBN:9781319013387
Author:David S. Moore, George P. McCabe, Bruce A. Craig
Publisher:W. H. Freeman