
MATLAB: An Introduction with Applications
6th Edition
ISBN: 9781119256830
Author: Amos Gilat
Publisher: John Wiley & Sons Inc
expand_more
expand_more
format_list_bulleted
Related questions
Question
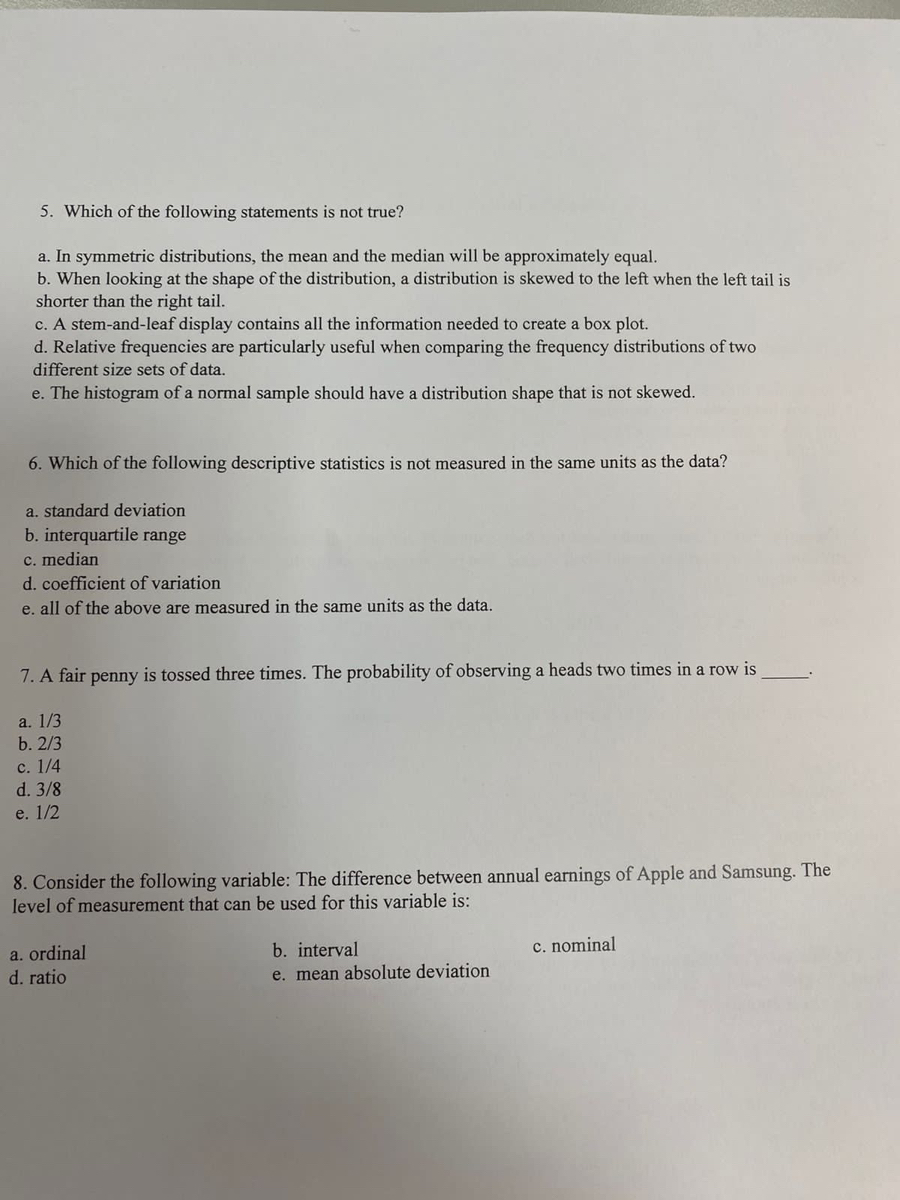

Transcribed Image Text:5. Which of the following statements is not true?
a. In symmetric distributions, the mean and the median will be approximately equal.
b. When looking at the shape of the distribution, a distribution is skewed to the left when the left tail is
shorter than the right tail.
c. A stem-and-leaf display contains all the information needed to create a box plot.
d. Relative frequencies are particularly useful when comparing the frequency distributions of two
different size sets of data.
e. The histogram of a normal sample should have a distribution shape that is not skewed.
6. Which of t
a. standard deviation
b. interquartile range
c. median
d. coefficient of variation
e. all of the above are measured in the same units as the data.
following descriptive statistics is not measured in the same units as the data?
7. A fair penny is tossed three times. The probability of observing a heads two times in a row is
a. 1/3
b. 2/3
c. 1/4
d. 3/8
e. 1/2
8. Consider the following variable: The difference between annual earnings of Apple and Samsung. The
level of measurement that can be used for this variable is:
a. ordinal
d. ratio
b. interval
e. mean absolute deviation
c. nominal
Expert Solution
This question has been solved!
Explore an expertly crafted, step-by-step solution for a thorough understanding of key concepts.

This is a popular solution

Trending nowThis is a popular solution!

Step by stepSolved in 4 steps with 1 images

Knowledge Booster

Similar questions
- 3. The data in the table shows the mileage that students commute to school. B. Find the weighted mean. Miles Midpoint Frequency 10 - 14 12 8 15 - 19 17 C. Draw a histogram for the data. 20 - 24 22 9 25 - 29 27 21 30 - 34 32 7 A. How many students are in the class?arrow_forwardWhat is the best way to graphically present the shape of the distribution of numeric variable? a. histogram b. scatter plot c. line graph d. pie chartarrow_forward10. Consider the box plot shown below: 2 4 6 8 10 12 14 16 a. What is the median of the data set? b. What are the upper and lower quartiles of the dataset? c. What is the interquartile range of the dataset? d. Is the data set skewed to the left, skewed to the right, of symmetric? e. What percentage of the observations in the data set lie to the right of the median? To the left of the upper quartile?arrow_forward
- Below are numbers of hours that a sample of 18 recent college graduates reported working last week. 55 48 46 64 68 43 37 44 63 54 45 48 52 39 50 51 65 38 Construct a box and whisker plot for the data.arrow_forwardBelow are numbers of hours that a sample of 19 recent college graduates reported working last week. 51, 64, 40, 70, 53, 62, 38, 71, 57, 48, 48, 36, 50, 61, 52, 65, 69, 35, 50 Send data to calculator Send data to Excel Using the tool provided, construct a box-and-whisker plot (sometimes called a boxplot) for the data. ? 35 40 45 50 55 60 65 70 75 Number of hours workedarrow_forward
arrow_back_ios
arrow_forward_ios
Recommended textbooks for you
- MATLAB: An Introduction with ApplicationsStatisticsISBN:9781119256830Author:Amos GilatPublisher:John Wiley & Sons Inc
 Probability and Statistics for Engineering and th...StatisticsISBN:9781305251809Author:Jay L. DevorePublisher:Cengage Learning
 Statistics for The Behavioral Sciences (MindTap C...StatisticsISBN:9781305504912Author:Frederick J Gravetter, Larry B. WallnauPublisher:Cengage Learning
  Elementary Statistics: Picturing the World (7th E...StatisticsISBN:9780134683416Author:Ron Larson, Betsy FarberPublisher:PEARSON
 The Basic Practice of StatisticsStatisticsISBN:9781319042578Author:David S. Moore, William I. Notz, Michael A. FlignerPublisher:W. H. Freeman
 Introduction to the Practice of StatisticsStatisticsISBN:9781319013387Author:David S. Moore, George P. McCabe, Bruce A. CraigPublisher:W. H. Freeman
MATLAB: An Introduction with Applications
Statistics
ISBN:9781119256830
Author:Amos Gilat
Publisher:John Wiley & Sons Inc
Probability and Statistics for Engineering and th...
Statistics
ISBN:9781305251809
Author:Jay L. Devore
Publisher:Cengage Learning
Statistics for The Behavioral Sciences (MindTap C...
Statistics
ISBN:9781305504912
Author:Frederick J Gravetter, Larry B. Wallnau
Publisher:Cengage Learning
Elementary Statistics: Picturing the World (7th E...
Statistics
ISBN:9780134683416
Author:Ron Larson, Betsy Farber
Publisher:PEARSON
The Basic Practice of Statistics
Statistics
ISBN:9781319042578
Author:David S. Moore, William I. Notz, Michael A. Fligner
Publisher:W. H. Freeman
Introduction to the Practice of Statistics
Statistics
ISBN:9781319013387
Author:David S. Moore, George P. McCabe, Bruce A. Craig
Publisher:W. H. Freeman