MATLAB: An Introduction with Applications
6th Edition
ISBN: 9781119256830
Author: Amos Gilat
Publisher: John Wiley & Sons Inc
expand_more
expand_more
format_list_bulleted
Question

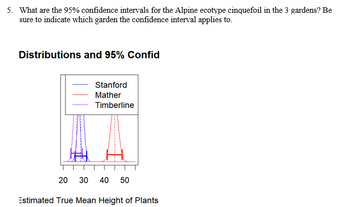
Transcribed Image Text:5. What are the 95% confidence intervals for the Alpine ecotype cinquefoil in the 3 gardens? Be
sure to indicate which garden the confidence interval applies to.
Distributions and 95% Confid
Stanford
Mather
Timberline
20
30
40
50
Estimated True Mean Height of Plants
SAVE
AI-Generated Solution
info
AI-generated content may present inaccurate or offensive content that does not represent bartleby’s views.
Unlock instant AI solutions
Tap the button
to generate a solution
to generate a solution
Click the button to generate
a solution
a solution
Knowledge Booster
Similar questions
- 1.23. |Mean and standard deviation. Enter the following data into the Data tab in the One-Variable Statistical Calculator applet: 8, 9, 10, 11, 12. Examine the Statistics tab and report the mean and the standard deviation. |Mean for different data. Refer to the previous exercise. Consider the data 8, 8, 9, 9, 10, 10, 11, 11, 12, 12. 1.24. (a) How would you expect the mean for these data to differ from what you found in the previous exercise? (b) Check your answer to part (a) using the One-Variable Statistical Calculator applet. (c) Repeat parts (a) and (b) of this exercise for the following data: 8, 8, 9, 9, 10, 10, 11, 11, 12, 13. Write a short explanation for what you have found. |Standard deviation for another set of data. Refer to Exercise 1.23. Consider the data 6, 8, 10, 12, 14. 1.25. (a) How would you expect the standard deviation for these data to differ from what you found in Exercise 1.23? (b) Check your answer to part (a) using the One-Variable Statistical Calculator applet.arrow_forwardSales personnel for Skilling Distributors submit weekly reports listing the customer contacts made during the week. A sample of 15 weekly reports showed a sample mean of 19.5 customer contacts per week. The sample standard deviation was 5.2. Provide a 90% confidence interval for the population mean number of weekly customer contacts for the sales personnel.arrow_forwardPLEASE ONLY SELECT THE ANSWERS AS SHOWN FOR THE MULTIPLE CHOICE, SUCH AS OPTION 1, 2, ETC. 1) In a test of the effectiveness of garlic for lowering cholesterol, 49 subjects were treated with raw garlic. Cholesterol levels were measured before and after the treatment. The changes (before minus after) in their levels of LDL cholesterol (in mg/dL) have a mean of 0.8 and a standard deviation of 1.51. Use a 0.10 significance level to test the claim that with garlic treatment, the mean change in LDL cholesterol is greater than 0. What do the results suggest about the effectiveness of the garlic treatment? Assume that a simple random sample has been selected. Identify the null and alternative hypotheses, test statistic, P-value, and state the final conclusion that addresses the original claim. What are the null and alternative hypotheses? A. H0: μ=0 mg/dL H1: μ<0 mg/dL B. H0: μ>0 mg/dL H1: μ<0 mg/dL C. H0: μ=0 mg/dL H1: μ≠0 mg/dL D. H0: μ=0 mg/dL H1: μ>0 mg/dL…arrow_forward
- An HR specialist wants to know, if the employees at the company he works for, work on average more than a full time week of 40 hours. He analyzes his data using SPSS. ( look at graphs) Was the test significant? Write the interpretation paragraph. (1) What was done 2) What test was done and what were the results (include APA) 3) What do the results mean? )arrow_forwardAlso need to find the standardized test statistic, decide whether to reject or fail to reject, and interpret the decision in the context of the claim.arrow_forwardConsider the sample dataset : 2,4,5,9,10. What is point estimate and sample standard deviation? What is margin of error at 95% confidence level? Calculate confidence intervals at 95% confidence level.arrow_forward
arrow_back_ios
arrow_forward_ios
Recommended textbooks for you
 MATLAB: An Introduction with ApplicationsStatisticsISBN:9781119256830Author:Amos GilatPublisher:John Wiley & Sons Inc
 Probability and Statistics for Engineering and th...StatisticsISBN:9781305251809Author:Jay L. DevorePublisher:Cengage Learning
 Statistics for The Behavioral Sciences (MindTap C...StatisticsISBN:9781305504912Author:Frederick J Gravetter, Larry B. WallnauPublisher:Cengage Learning
 Elementary Statistics: Picturing the World (7th E...StatisticsISBN:9780134683416Author:Ron Larson, Betsy FarberPublisher:PEARSON
 The Basic Practice of StatisticsStatisticsISBN:9781319042578Author:David S. Moore, William I. Notz, Michael A. FlignerPublisher:W. H. Freeman
 Introduction to the Practice of StatisticsStatisticsISBN:9781319013387Author:David S. Moore, George P. McCabe, Bruce A. CraigPublisher:W. H. Freeman

MATLAB: An Introduction with Applications
Statistics
ISBN:9781119256830
Author:Amos Gilat
Publisher:John Wiley & Sons Inc

Probability and Statistics for Engineering and th...
Statistics
ISBN:9781305251809
Author:Jay L. Devore
Publisher:Cengage Learning

Statistics for The Behavioral Sciences (MindTap C...
Statistics
ISBN:9781305504912
Author:Frederick J Gravetter, Larry B. Wallnau
Publisher:Cengage Learning

Elementary Statistics: Picturing the World (7th E...
Statistics
ISBN:9780134683416
Author:Ron Larson, Betsy Farber
Publisher:PEARSON

The Basic Practice of Statistics
Statistics
ISBN:9781319042578
Author:David S. Moore, William I. Notz, Michael A. Fligner
Publisher:W. H. Freeman

Introduction to the Practice of Statistics
Statistics
ISBN:9781319013387
Author:David S. Moore, George P. McCabe, Bruce A. Craig
Publisher:W. H. Freeman