MATLAB: An Introduction with Applications
6th Edition
ISBN: 9781119256830
Author: Amos Gilat
Publisher: John Wiley & Sons Inc
expand_more
expand_more
format_list_bulleted
Question

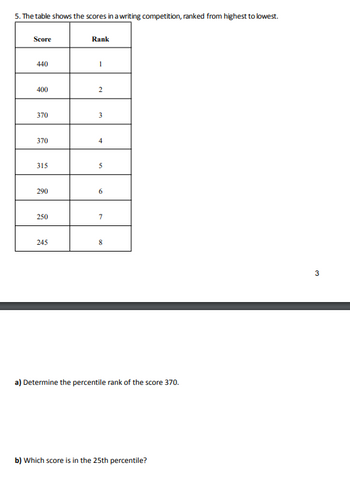
Transcribed Image Text:5. The table shows the scores in a writing competition, ranked from highest to lowest.
Score
440
400
370
370
315
290
250
245
Rank
1
2
3
4
5
6
7
8
a) Determine the percentile rank of the score 370.
b) Which score is in the 25th percentile?
3
Expert Solution
This question has been solved!
Explore an expertly crafted, step-by-step solution for a thorough understanding of key concepts.
Step by stepSolved in 2 steps with 1 images

Knowledge Booster
Similar questions
- can i get help with this too?arrow_forwardFind the 5 number summary for the data shown 17 21 29 30 36 42 56 60 88 91 94 97 5 number summary:Use the Locator/Percentile method described in your book, not your calculator.arrow_forwardBiologists caught and measured 215 fish from the northern Atlantic Ocean. The lengths of the fish (in cm) are summarized in the histogram. 40 35 30 25 20 15 10 5 15 30 45 60 75 90 105 120 length of fish (cm) About what percentage of fish caught in this study had lengths between 45 cm and 75 cm? % Frequencyarrow_forward
- A teacher wants to assign an 'A' grade to everyone that scores in the 80th percentile. The grades are: 8 10 12 15 25 40 50 55 60 75 85 90 What is the 80th percentile value What is the meaningarrow_forwardA pediatrician wants to determine the relation that may exist between a child's height and head circumference. She randomly selects 8 children from her practice, measures their height and head circumference and obtains the data shown below. Height Head Circumference 27 17.5 25 17 26.5 17.2 25.5 17 27.75 17.4 26.25 17.4 26 17.1 27.25 17.4 data table n 3 0.997 4 0.950 5 0.878 6 0.811 7 0.754 8 0.707 9 0.666 10 0.632 11 0.602 12 0.576 13 0.553 14 0.532 15 0.514 16 0.497 17 0.482 18 0.468 19 0.456 20 0.444 21 0.433 22 0.423 23 0.413 24 0.404 25 0.396 26 0.388 27 0.381 28 0.374 29 0.367 30 0.361 compute the linear correlation coefficient between the height and head circumference of a child. r = ____ (round to three decimal places as…arrow_forwardTwenty-five randomly selected students were asked the number of movies they watched the previous week. The results are as follows. # of movies Frequency Relative Frequency Cumulative Relative Frequency 0 5 1 9 2 6 3 4 4 1 Table 2.67 Construct a histogram of the data. Complete the columns of the chart.arrow_forward
- 2. Using the frequency/percentage distribution table below to find the median, 12t percentile, 25th percentile (1" quartile), 75th percentile (3rd quartile) and inter-quartile range (1QR) for the variable "mumber of rooms in respondents' home or apartment." Write one sentence interpreting each statistics. Number of rooms Cumulative Frequency Percent Valid Percent Percent Valid 153 room 7 .8 .8 244 1.2 1.2 2.0 3 968 4.7 4.9 6.9 2507 12.1 12.8 19.7 3758 18.1 19.1 38.8 3972 19.1 20.2 59.1 2965 14.3 15.1 74.2 2186 10.5 11.1 85.3 1146 5.5 5.8 91.1 10 868 4.2 4.4 95.5 11 373 1.8 1.9 97.4 12 217 1.0 1.1 98.5 13 77 4 4 98.9 14 35 2 99.1 15 22 .1 .1 99.2 16 15 .1 .1 99.3 17 47 2 99.5 18 40 2 99.8 19 30 .1 99.9 20 9 .0 .0 99.9 21 5 100.0 22 .0 100.0 Total 19642 94.4 100.0 Missing N/A 1160 5.6 Total 20802 100.0arrow_forwardThe data represent the time, in minutes, spent reading a political blog in a day. Construct a frequency distribution using 5 dlassos. In the table, include the midpoints, relative frequencies, and cumulative frequencies. Which class has the greatest frequency and which has the least frequency? 4. 38 42 25 46 49 48 21 34 9 35 38 8. 47 3. 29 32 26 Complete the table, starting with the lowest class limit. (Simplify your answers.) Relative Cumulative Class Frequency Midpoint Frequency Frequency Which class has the greatest frequency? The class with the greatest frequency is from to. Which class has the least frequency? The class with the least frequency is from toarrow_forward
arrow_back_ios
arrow_forward_ios
Recommended textbooks for you
 MATLAB: An Introduction with ApplicationsStatisticsISBN:9781119256830Author:Amos GilatPublisher:John Wiley & Sons Inc
 Probability and Statistics for Engineering and th...StatisticsISBN:9781305251809Author:Jay L. DevorePublisher:Cengage Learning
 Statistics for The Behavioral Sciences (MindTap C...StatisticsISBN:9781305504912Author:Frederick J Gravetter, Larry B. WallnauPublisher:Cengage Learning
 Elementary Statistics: Picturing the World (7th E...StatisticsISBN:9780134683416Author:Ron Larson, Betsy FarberPublisher:PEARSON
 The Basic Practice of StatisticsStatisticsISBN:9781319042578Author:David S. Moore, William I. Notz, Michael A. FlignerPublisher:W. H. Freeman
 Introduction to the Practice of StatisticsStatisticsISBN:9781319013387Author:David S. Moore, George P. McCabe, Bruce A. CraigPublisher:W. H. Freeman

MATLAB: An Introduction with Applications
Statistics
ISBN:9781119256830
Author:Amos Gilat
Publisher:John Wiley & Sons Inc

Probability and Statistics for Engineering and th...
Statistics
ISBN:9781305251809
Author:Jay L. Devore
Publisher:Cengage Learning

Statistics for The Behavioral Sciences (MindTap C...
Statistics
ISBN:9781305504912
Author:Frederick J Gravetter, Larry B. Wallnau
Publisher:Cengage Learning

Elementary Statistics: Picturing the World (7th E...
Statistics
ISBN:9780134683416
Author:Ron Larson, Betsy Farber
Publisher:PEARSON

The Basic Practice of Statistics
Statistics
ISBN:9781319042578
Author:David S. Moore, William I. Notz, Michael A. Fligner
Publisher:W. H. Freeman

Introduction to the Practice of Statistics
Statistics
ISBN:9781319013387
Author:David S. Moore, George P. McCabe, Bruce A. Craig
Publisher:W. H. Freeman