
MATLAB: An Introduction with Applications
6th Edition
ISBN: 9781119256830
Author: Amos Gilat
Publisher: John Wiley & Sons Inc
expand_more
expand_more
format_list_bulleted
Related questions
Topic Video
Question
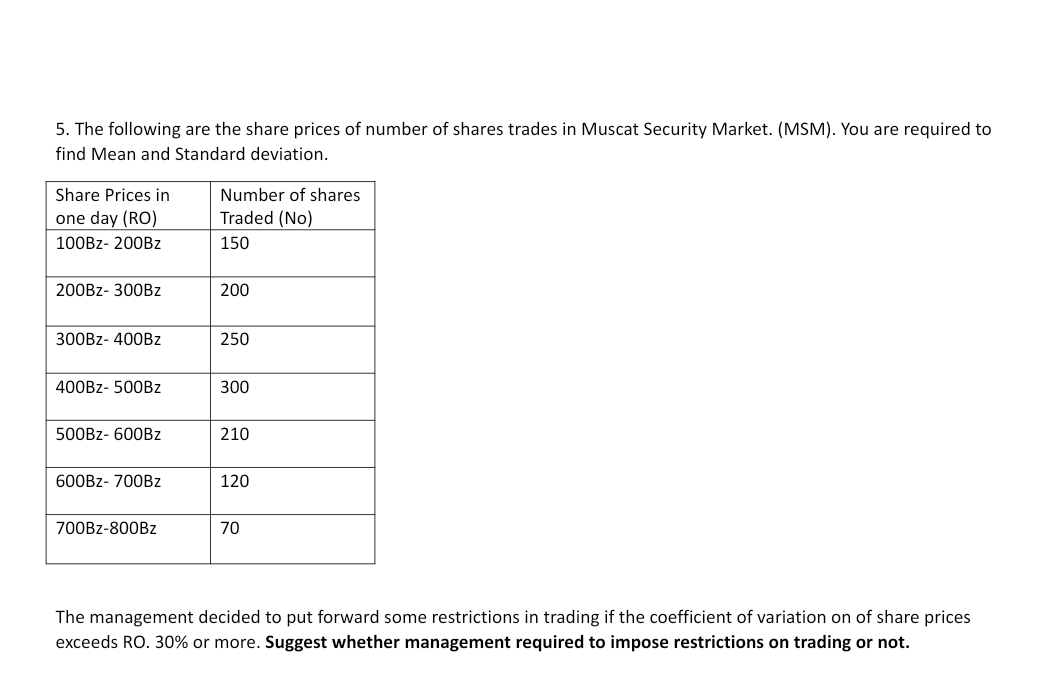

Transcribed Image Text:5. The following are the share prices of number of shares trades in Muscat Security Market. (MSM). You are required to
find Mean and Standard deviation.
Share Prices in
Number of shares
one day (RO)
Traded (No)
100BZ- 200BZ
150
200BZ- 300BZ
200
300BZ- 400BZ
250
400BZ- 500BZ
300
500BZ- 600BZ
210
600BZ- 700BZ
120
700BZ-800BZ
70
The management decided to put forward some restrictions in trading if the coefficient of variation on of share prices
exceeds RO. 30% or more. Suggest whether management required to impose restrictions on trading or not.
Expert Solution
This question has been solved!
Explore an expertly crafted, step-by-step solution for a thorough understanding of key concepts.

Step by stepSolved in 4 steps with 3 images

Knowledge Booster


Learn more about
Need a deep-dive on the concept behind this application? Look no further. Learn more about this topic, statistics and related others by exploring similar questions and additional content below.Similar questions
- I wanted to test if the mean Exam 3 score in this course was different than the mean Exam 2 score. To conduct this test I used the 30 students in my course last semester as my sample. I first calculated the difference in scores between Exam 2 and Exam 3 ("Exam 2 score - Exam 3 score"). The sample mean of these differences is 2.0 and the sample standard deviation of the differences is 3.0. What is your decision for this test? Group of answer choices 1. Reject the null hypothesis 2. Retain the null hypothesisarrow_forwardKathy and her brother Clay recently ran in a local marathon. The distribution of finishing timefor women was approximately normal with mean 259 minutes and standard deviation 32minutes. The distribution of finishing time for men was approximately normal with mean 242minutes and standard deviation 29 minutes. (a) The finishing time for Clay was 289 minutes. Calculate and interpret the standardized scorefor Clay’s marathon time. Show your work. (b) The finishing time for Kathy was 272 minutes. What proportion of women who ran themarathon had a finishing time less than Kathy’s? Show your work. (c) The standard deviation of finishing time is greater for women than for men. What does thisindicate about the finishing times of the women who ran the marathon compared to thefinishing times of the men who ran the marathon?arrow_forwardSuppose that the time spent by children in front of the television set per year has the distribution N(1500, 250) What proportion of children spend less than 1000 hours in front of the television?arrow_forward
- Pleasearrow_forwardThe Credit Risk Department of a major bank estimates the default rate on loans under $10,000 to be 4%. The bank will make 2400 loans that are under $10,000 next month. Find the mean of ^p, where ^p is the proportion of defaults on the 2400 loans under $10,000 to be made next month.arrow_forward6. Scientists estimate that the distribution of the life span of the Galápagos Islands giant tortoise is approximately normal with mean 100 years and standard deviation 15 years. Based on the estimate, which of the following is closest to the age of a Galápagos Islands giant tortoise at the 90th percentile of the distribution? (A) 80 years (B) 115 years (C) 120 years (D) 125 years (E) 130yearsarrow_forward
- Suppose that the quarterly sales levels among health care information systems companies are approximately normally distributed with a mean of 8vmillion dollars and a standard deviation of 1.1million dollars. One health care information systems company considers a quarter a "failure" if its sales level that quarter is in the bottom 15%of all quarterly sales levels. Determine the sales level (in millions of dollars) that is the cutoff between quarters that are considered "failures" by that company and quarters that are not. Carry your intermediate computations to at least four decimal places. Round your answer to one decimal place.arrow_forwardWeights of female cats of a certain breed are normally distributed with mean 4.1 kg and standard deviation 0.6 kg. (i). What proportion of female cats have weights between 3.7 and 4.4 kg? . (ii). A certain female cat has a weight that is 0.5 standard deviations above the mean. What proportion of female cats are heavier than this one?. (iii). How heavy is a female cat whose weight is on the 80th percentile?. (iv). A female cat is chosen at random. What is the probability that she weighs more than 4.5 kg? . (v). Five female cats are chosen at random. What is the probability that exactly one of them weighs more than 4.5 kg? .arrow_forwardAccording to the New York Daily News, March 5, 2014, people 65 years and older watch an average of 50.5 hours of TV per week. We will estimate the standard deviation to be 12.7 hours per week. Your town has many social programs for senior citizens which may reduce the amount of TV that older people watch. You want to find out if it is true that people 65 and older in your town watch less than 50.5 hours of TV per week. So, you sample 40 people 65 and older in your town. You find that the average time that the 40 people watch per week is 45.8 hours. Can the claim be supported to a level of significance of α = .02, test the hypothesis?arrow_forward
arrow_back_ios
arrow_forward_ios
Recommended textbooks for you
- MATLAB: An Introduction with ApplicationsStatisticsISBN:9781119256830Author:Amos GilatPublisher:John Wiley & Sons Inc
 Probability and Statistics for Engineering and th...StatisticsISBN:9781305251809Author:Jay L. DevorePublisher:Cengage Learning
 Statistics for The Behavioral Sciences (MindTap C...StatisticsISBN:9781305504912Author:Frederick J Gravetter, Larry B. WallnauPublisher:Cengage Learning
  Elementary Statistics: Picturing the World (7th E...StatisticsISBN:9780134683416Author:Ron Larson, Betsy FarberPublisher:PEARSON
 The Basic Practice of StatisticsStatisticsISBN:9781319042578Author:David S. Moore, William I. Notz, Michael A. FlignerPublisher:W. H. Freeman
 Introduction to the Practice of StatisticsStatisticsISBN:9781319013387Author:David S. Moore, George P. McCabe, Bruce A. CraigPublisher:W. H. Freeman
MATLAB: An Introduction with Applications
Statistics
ISBN:9781119256830
Author:Amos Gilat
Publisher:John Wiley & Sons Inc
Probability and Statistics for Engineering and th...
Statistics
ISBN:9781305251809
Author:Jay L. Devore
Publisher:Cengage Learning
Statistics for The Behavioral Sciences (MindTap C...
Statistics
ISBN:9781305504912
Author:Frederick J Gravetter, Larry B. Wallnau
Publisher:Cengage Learning
Elementary Statistics: Picturing the World (7th E...
Statistics
ISBN:9780134683416
Author:Ron Larson, Betsy Farber
Publisher:PEARSON
The Basic Practice of Statistics
Statistics
ISBN:9781319042578
Author:David S. Moore, William I. Notz, Michael A. Fligner
Publisher:W. H. Freeman
Introduction to the Practice of Statistics
Statistics
ISBN:9781319013387
Author:David S. Moore, George P. McCabe, Bruce A. Craig
Publisher:W. H. Freeman