
MATLAB: An Introduction with Applications
6th Edition
ISBN: 9781119256830
Author: Amos Gilat
Publisher: John Wiley & Sons Inc
expand_more
expand_more
format_list_bulleted
Related questions
Question
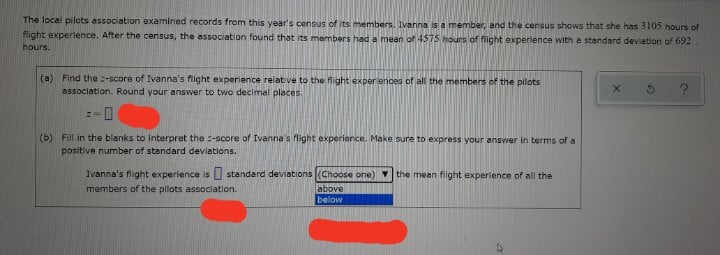

Transcribed Image Text:The local pilots association examined records from this year's census of its members. Ivanna is a member, and the census shows that she has 3105 hours of
Flight experience. After the census, the association found that its members had a mean of 4575 hours of flight experience with a standard deviation of 692
hours.
(a) Find the -score of Ivanna's flight experience relative to the flight exper ences of all the members of the pilots
association. Round your answer to two decimal places.
(b) Fill in the blanks to Interpret the -score of Ivanna's flight experience. Make sure to express your answer in terms of a
positive number of standard deviations.
Ivanna's flight experience is standard deviations (Choose one) the mean flight experience of all the
members of the pllots association.
above
below
Expert Solution
This question has been solved!
Explore an expertly crafted, step-by-step solution for a thorough understanding of key concepts.

This is a popular solution

Trending nowThis is a popular solution!

Step by stepSolved in 2 steps with 1 images

Knowledge Booster

Similar questions
- A mathematics professor lost a test paper belonging to one of her students. She remembered that the mean score for the class of 20 was 81 and that the sum of the 19 other scores was 1530. What was the grade on the paper she lost?arrow_forwardWhat is the highest relative score earned on a test?arrow_forwardColleges announce an "average" SAT score for their entering freshmen. Usually the college would like this "average" to be as high as possible. A NewYork Times article noted, "Private colleges that buy lots of top students with merit scholarships prefer the mean, while open-enrollment public instituions like medians." Use what you know about the behavior of means and medians to explain these differences.arrow_forward
- The blue catfish (Ictalurus Furcatus) is the largest species of North American catfish. The current world record stands at 143 pounds, which was caught in the John H. Kerr Reservoir (Bugg's Island Lake) located in Virginia. According to American Expedition, the average weight of a blue catfish is between 20 to 40 pounds. Given that the largest blue catfish ever caught was at the John H. Kerr Reservoir, you believe that the mean weight of the fish in this reservoir is greater than 40 pounds. Use the data below, which represents the summary statistics for 42 blue catfish caught at this reservoir, and a 0.05 significance level to test the claim that the mean weight of the fish in the John H. Kerr Reservoir is greater than 40 pounds. n=42; ¯x=40.63 pounds; s=3.49 pounds a) Identify the null and alternative hypotheses?H0: H1: c) Identify the appropriate significance level.d) Calculate your test statistic. Write the result below, and be sure to round your final answer to two…arrow_forwardmake up 2 data sets, each with 5 values, that have the same mean and median, but different standard deviations.arrow_forwardThe blue catfish (Ictalurus Furcatus) is the largest species of North American catfish. The current world record stands at 143 pounds, which was caught in the John H. Kerr Reservoir (Bugg's Island Lake) located in Virginia. According to American Expedition, the average weight of a blue catfish is between 20 to 40 pounds. Given that the largest blue catfish ever caught was at the John H. Kerr Reservoir, you believe that the mean weight of the fish in this reservoir is greater than 40 pounds. Use the data below, which represents the summary statistics for 50 blue catfish caught at this reservoir, and a 0.05 significance level to test the claim that the mean weight of the fish in the John H. Kerr Reservoir is greater than 40 pounds. n=50 ; ¯x=40.49 pounds; s=3.49 pounds a) Identify the null and alternative hypotheses? H0: H1: b) What type of hypothesis test should you conduct (left-, right-, or two-tailed)? left-tailed right-tailed two-tailed c) Identify the appropriate significance…arrow_forward
- The median of a sample with data values of 8,19,12,17,16 is?arrow_forwardA clinical psychologist took a sample of four people from the population of people with anxiety disorders and gave them an interval-level anxiety scale. Their score were 57, 60, 67, and 68 with a mean of 63.00. What is s?arrow_forwardA researcher surveyed ten (10) patients at a doctor's office using a questionnaire. The participants (or their guardians) provided their ages. 12, 1, 9 , 50, 34, 40,18, 29, 16, 46 What is the mean age for the participants in the sample? (Round to nearest hundredth, if needed).arrow_forward
arrow_back_ios
arrow_forward_ios
Recommended textbooks for you
- MATLAB: An Introduction with ApplicationsStatisticsISBN:9781119256830Author:Amos GilatPublisher:John Wiley & Sons Inc
 Probability and Statistics for Engineering and th...StatisticsISBN:9781305251809Author:Jay L. DevorePublisher:Cengage Learning
 Statistics for The Behavioral Sciences (MindTap C...StatisticsISBN:9781305504912Author:Frederick J Gravetter, Larry B. WallnauPublisher:Cengage Learning
  Elementary Statistics: Picturing the World (7th E...StatisticsISBN:9780134683416Author:Ron Larson, Betsy FarberPublisher:PEARSON
 The Basic Practice of StatisticsStatisticsISBN:9781319042578Author:David S. Moore, William I. Notz, Michael A. FlignerPublisher:W. H. Freeman
 Introduction to the Practice of StatisticsStatisticsISBN:9781319013387Author:David S. Moore, George P. McCabe, Bruce A. CraigPublisher:W. H. Freeman
MATLAB: An Introduction with Applications
Statistics
ISBN:9781119256830
Author:Amos Gilat
Publisher:John Wiley & Sons Inc
Probability and Statistics for Engineering and th...
Statistics
ISBN:9781305251809
Author:Jay L. Devore
Publisher:Cengage Learning
Statistics for The Behavioral Sciences (MindTap C...
Statistics
ISBN:9781305504912
Author:Frederick J Gravetter, Larry B. Wallnau
Publisher:Cengage Learning
Elementary Statistics: Picturing the World (7th E...
Statistics
ISBN:9780134683416
Author:Ron Larson, Betsy Farber
Publisher:PEARSON
The Basic Practice of Statistics
Statistics
ISBN:9781319042578
Author:David S. Moore, William I. Notz, Michael A. Fligner
Publisher:W. H. Freeman
Introduction to the Practice of Statistics
Statistics
ISBN:9781319013387
Author:David S. Moore, George P. McCabe, Bruce A. Craig
Publisher:W. H. Freeman