
MATLAB: An Introduction with Applications
6th Edition
ISBN: 9781119256830
Author: Amos Gilat
Publisher: John Wiley & Sons Inc
expand_more
expand_more
format_list_bulleted
Related questions
Question
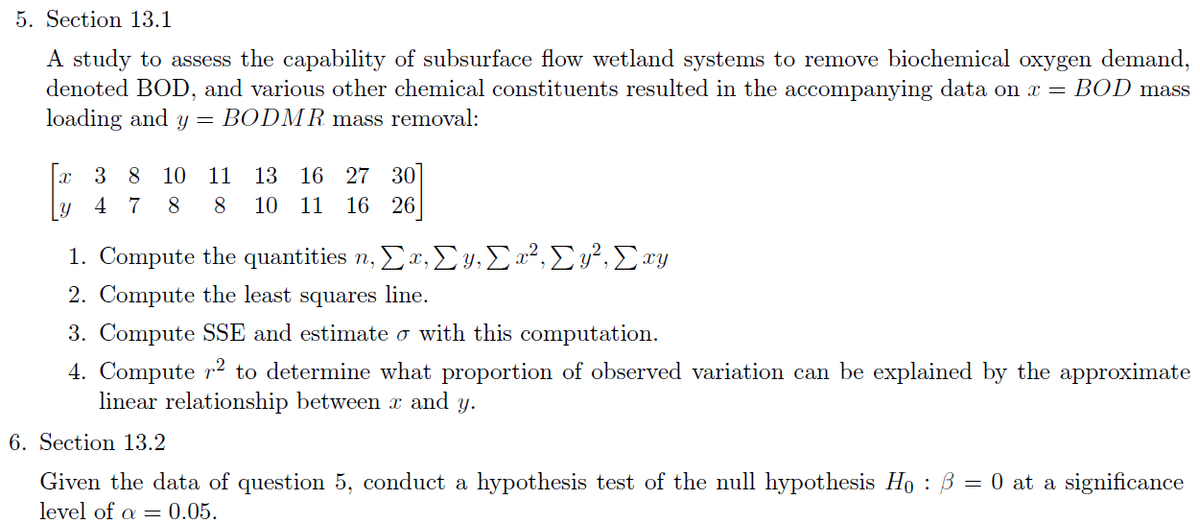

Transcribed Image Text:5. Section 13.1
A study to assess the capability of subsurface flow wetland systems to remove biochemical oxygen demand,
denoted BOD, and various other chemical constituents resulted in the accompanying data on x = BOD mass
loading and y = BODMR mass removal:
3 8 10
11
13 16 27 30
47 8 8
10 11 16 26
1. Compute the quantities n, Σ x, y, Σx², Cy², Σxy
2. Compute the least squares line.
3. Compute SSE and estimate σ with this computation.
4. Computer² to determine what proportion of observed variation can be explained by the approximate
linear relationship between x and y.
6. Section 13.2
Given the data of question 5, conduct a hypothesis test of the null hypothesis Hoẞ = 0 at a significance
level of α = 0.05.
Expert Solution
This question has been solved!
Explore an expertly crafted, step-by-step solution for a thorough understanding of key concepts.

Step by stepSolved in 2 steps

Knowledge Booster

Similar questions
- 14. Solve the bacteria-nutrition problem when the given data are as in the following table and the nutrients are supplied daily in amounts of 900 units of N₁, 750 units of №₂, and 1250 units of N₁.The answer states the number of each type of bacterium to be inserted in the culture. N₁ N₂ N3 B₁ 2 1 3 B₁ 1 3 1 B₂ 5 1 7arrow_forwardIQuestion 1] a. The following table shows demand (x) and supply (v) for a sample of a certain commodity. 12 7 11 19 5 21 3 4 17 14 3 21 28 6 43 1 12 30 y i. Plot the points on a scatter graph and state the relationship between the two variables. ii. Calculate the value of the product moment correlation coefficient for the data and comment briefly. b. Company Y wants to determine the cost-volume relation between its factory overhead cost and number of units produced. The volume and the corresponding total cost information of the factory for past eight months are given below: Month 2 3 4 5 6 7 8. Units 1,520 1,250 1,750 1,600 2,350 2,100 3,000 2,750 FOH S36,375 $38,000 $41,750 S42,360 $55,080 SS48,100 $59,000 $56,800 Factory Overhead costs of Company Y i. Use the high-low method to split its factory overhead (FOH) costs into fixed and variable components and create a cost volume formula. ii. Briefly explain why this method is unreliable as a means of cost estimation and suggest one other…arrow_forwardConsider the following pairs of measurements: a. Use Stata to chart a scattergram for the data. Show the graph below. X 5 8 3 4 9 Y 6.2 3.4 7.5 8.1 3.2 b. Use Stata to estimate the least squares model between X and Y. Copy the output below and specify the least squares equation. c. What are SSE, s2, and s?arrow_forward
- 4.5q8arrow_forward4. Given the following data, do a quadratic least squares polynomial fit using P2(r) = ao + a1r + azx?. Yi Yi Yi -1.0 7.904 -0.3 0.335 0.4 -0.711 0.224 0.689 -0.9 7.452 -0.2 -0.271 0.5 -0.8 5.827 -0.1 -0.963 0.6 0.7 -0.7 4.400 -0.847 0.861 -0.6 2.908 0.1 -1.278 0.8 1.358 -0.5 2.144 0.2 -1.335 0.9 2.613 -0.4 0.581 0.3 -0.656 1.0 4.599arrow_forward
arrow_back_ios
arrow_forward_ios
Recommended textbooks for you
- MATLAB: An Introduction with ApplicationsStatisticsISBN:9781119256830Author:Amos GilatPublisher:John Wiley & Sons Inc
 Probability and Statistics for Engineering and th...StatisticsISBN:9781305251809Author:Jay L. DevorePublisher:Cengage Learning
 Statistics for The Behavioral Sciences (MindTap C...StatisticsISBN:9781305504912Author:Frederick J Gravetter, Larry B. WallnauPublisher:Cengage Learning
  Elementary Statistics: Picturing the World (7th E...StatisticsISBN:9780134683416Author:Ron Larson, Betsy FarberPublisher:PEARSON
 The Basic Practice of StatisticsStatisticsISBN:9781319042578Author:David S. Moore, William I. Notz, Michael A. FlignerPublisher:W. H. Freeman
 Introduction to the Practice of StatisticsStatisticsISBN:9781319013387Author:David S. Moore, George P. McCabe, Bruce A. CraigPublisher:W. H. Freeman
MATLAB: An Introduction with Applications
Statistics
ISBN:9781119256830
Author:Amos Gilat
Publisher:John Wiley & Sons Inc
Probability and Statistics for Engineering and th...
Statistics
ISBN:9781305251809
Author:Jay L. Devore
Publisher:Cengage Learning
Statistics for The Behavioral Sciences (MindTap C...
Statistics
ISBN:9781305504912
Author:Frederick J Gravetter, Larry B. Wallnau
Publisher:Cengage Learning
Elementary Statistics: Picturing the World (7th E...
Statistics
ISBN:9780134683416
Author:Ron Larson, Betsy Farber
Publisher:PEARSON
The Basic Practice of Statistics
Statistics
ISBN:9781319042578
Author:David S. Moore, William I. Notz, Michael A. Fligner
Publisher:W. H. Freeman
Introduction to the Practice of Statistics
Statistics
ISBN:9781319013387
Author:David S. Moore, George P. McCabe, Bruce A. Craig
Publisher:W. H. Freeman