
Introductory Circuit Analysis (13th Edition)
13th Edition
ISBN: 9780133923605
Author: Robert L. Boylestad
Publisher: PEARSON
expand_more
expand_more
format_list_bulleted
Related questions
Question
solve with great detail
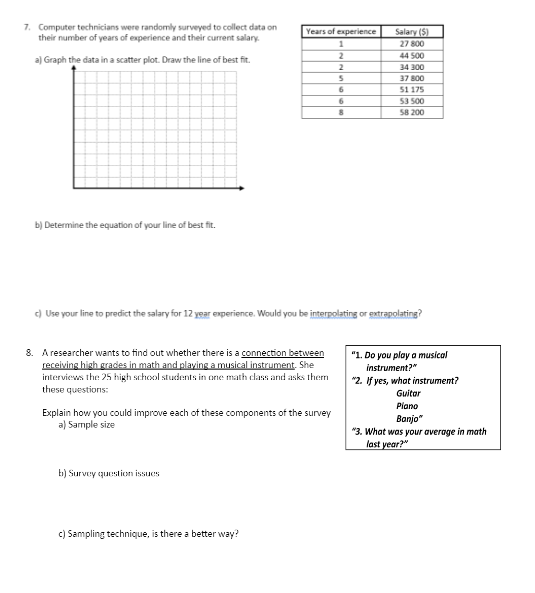

Transcribed Image Text:7. Computer technicians were randomly surveyed to collect data on
their number of years of experience and their current salary.
a) Graph the data in a scatter plot. Draw the line of best fit.
Years of experience
b) Determine the equation of your line of best fit.
Salary (5)
1
27 800
2
44 500
2
34 300
5
37 800
6
51 175
6
53 500
8
58 200
c) Use your line to predict the salary for 12 year experience. Would you be interpolating or extrapolating?
8. A researcher wants to find out whether there is a connection between
receiving high grades in math and playing a musical instrument. She
interviews the 25 high school students in one math class and asks them
these questions:
Explain how you could improve each of these components of the survey
a) Sample size
"1. Do you play a musical
instrument?"
"2. If yes, what instrument?
Guitar
Piano
Banjo"
"3. What was your average in math
last year?"
b) Survey question issues
c) Sampling technique, is there a better way?

Transcribed Image Text:5. For a data management project, Ryan sent a survey to the teachers in his school, asking them to how many years
they have taught. Here are their responses:
0, 1, 2, 2, 3, 3, 5, 5, 12, 12, 13, 14, 15, 17, 17, 18, 18, 18, 19, 22, 25, 27, 40
a) Calculate the mean, median and mode.
b) Determine the first quartile and the third quartiles?
c) What percentile rank is associated with 10 years of teaching?
6. Use the graph below to answer the following questions.
Fam Product Price Index
Index Value (1997-100)
115-
110
106
100
的
90
05
80
75
70
1851
1005
051
sent
2051
1998
Year
c00e
Spo
me
1000
100
2005
2006
a) Why do all the lines intersect at 1997?
Too Fam
Products
-Том Стора
b) Which line seems to be the most unpredictable?
c) Name one year when crops were doing better
than livestock:
--Total Livestock
and Anal
Products
d) If 10 pounds of potatoes costs $4.99 in 1997,
estimate their cost in 2005.
Expert Solution
This question has been solved!
Explore an expertly crafted, step-by-step solution for a thorough understanding of key concepts.

Step by stepSolved in 2 steps with 1 images

Knowledge Booster

Similar questions
- al C2 C3 C1 C4 Find Ceg at the (a,b) terminals given that C-4.6 IF C2-7.3 uF C3-3.6 UF CA-6.3 uF Note: Your answer should be round to the nearest single digit decimal place. Your answer will be in micorFarads. For example, if you compute 1.63x10-° then enter 1.6 as your answer. 52 F P Type here to search delete iome backspace lock 9.arrow_forwardExplain diagramarrow_forwardR148 R149 R150 If R148 is 18 Ohms, R149 is 13 Ohms, R150 is 25 Ohms, and there is 4 Amps flowing through R150, what is the current through R148? Please show 3 decimal places and don't include units in your answer (i.e. don't include A in your answer).arrow_forward
- Shown in the figure below is an electrical circuit containing three resistors and two batteries. R3 10 R2 R1 Write down the Kirchhoff Junction equation and solve it for I, in terms of I, and Iz. Write the result here: Write down the Kirchhoff Loop equation for a loop that starts at the lower left corner and follows the perimeter of the circuit diagram clockwise. Write down the Kirchhoff Loop equation for a loop that starts at the lower left corner and touches the components R1, R2, and 4V. The resistors in the circuit have the following values: R, = 130 • R2 = 50 R3 = 10 Solve for all the following (some answers may be negative): | Amperes I = I, = Amperes Iz = Amperes NOTE: For the equations, put in resistances and currents SYMBOLICALLY using variables like RR2,R3 and I,,12,13. Use numerical values of 10 and 4 for the voltages.arrow_forwardRead and solve carefully please write clearly and box the final answerarrow_forward
arrow_back_ios
arrow_forward_ios
Recommended textbooks for you
- Introductory Circuit Analysis (13th Edition)Electrical EngineeringISBN:9780133923605Author:Robert L. BoylestadPublisher:PEARSON
 Delmar's Standard Textbook Of ElectricityElectrical EngineeringISBN:9781337900348Author:Stephen L. HermanPublisher:Cengage Learning
 Programmable Logic ControllersElectrical EngineeringISBN:9780073373843Author:Frank D. PetruzellaPublisher:McGraw-Hill Education
  Fundamentals of Electric CircuitsElectrical EngineeringISBN:9780078028229Author:Charles K Alexander, Matthew SadikuPublisher:McGraw-Hill Education
 Electric Circuits. (11th Edition)Electrical EngineeringISBN:9780134746968Author:James W. Nilsson, Susan RiedelPublisher:PEARSON
 Engineering ElectromagneticsElectrical EngineeringISBN:9780078028151Author:Hayt, William H. (william Hart), Jr, BUCK, John A.Publisher:Mcgraw-hill Education,
Introductory Circuit Analysis (13th Edition)
Electrical Engineering
ISBN:9780133923605
Author:Robert L. Boylestad
Publisher:PEARSON
Delmar's Standard Textbook Of Electricity
Electrical Engineering
ISBN:9781337900348
Author:Stephen L. Herman
Publisher:Cengage Learning
Programmable Logic Controllers
Electrical Engineering
ISBN:9780073373843
Author:Frank D. Petruzella
Publisher:McGraw-Hill Education
Fundamentals of Electric Circuits
Electrical Engineering
ISBN:9780078028229
Author:Charles K Alexander, Matthew Sadiku
Publisher:McGraw-Hill Education
Electric Circuits. (11th Edition)
Electrical Engineering
ISBN:9780134746968
Author:James W. Nilsson, Susan Riedel
Publisher:PEARSON
Engineering Electromagnetics
Electrical Engineering
ISBN:9780078028151
Author:Hayt, William H. (william Hart), Jr, BUCK, John A.
Publisher:Mcgraw-hill Education,