
MATLAB: An Introduction with Applications
6th Edition
ISBN: 9781119256830
Author: Amos Gilat
Publisher: John Wiley & Sons Inc
expand_more
expand_more
format_list_bulleted
Related questions
Question
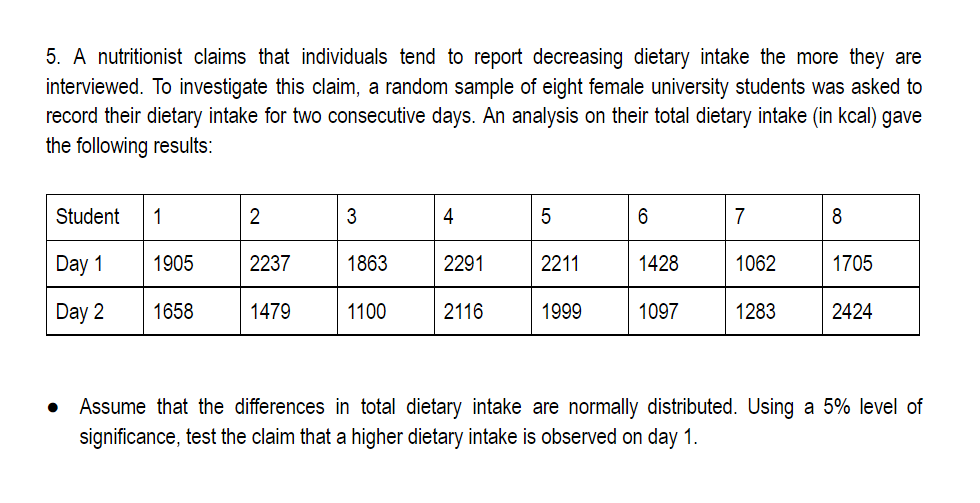

Transcribed Image Text:5. A nutritionist claims that individuals tend to report decreasing dietary intake the more they are
interviewed. To investigate this claim, a random sample of eight female university students was asked to
record their dietary intake for two consecutive days. An analysis on their total dietary intake (in kcal) gave
the following results:
Student
1
2
4
7
8
Day 1
1905
2237
1863
2291
2211
1428
1062
1705
Day 2
1658
1479
1100
2116
1999
1097
1283
2424
Assume that the differences in total dietary intake are normally distributed. Using a 5% level of
significance, test the claim that a higher dietary intake is observed on day 1.
Expert Solution
This question has been solved!
Explore an expertly crafted, step-by-step solution for a thorough understanding of key concepts.

Step by stepSolved in 2 steps with 2 images

Knowledge Booster

Similar questions
- You are interested in comparing sleep habits of elementary school children. Suppose you have agroup of eighth graders. You asked them in July to estimate about how many hours of sleep they get pernight, on average. You asked those same individuals the same question again in November, during theschool year. Which is the most appropriate test to use?arrow_forwardHow productive are U.S. workers? One way to answer this question is to study annual profits per employee. A random sample of companies in computers (I), aerospace (II), heavy equipment (III), and broadcasting (IV) gave the following data regarding annual profits per employee (units in thousands of dollars). I II III IV 27.9 13.5 22.2 17.9 23.2 9.6 20.5 16.4 14.7 11.1 7.7 14.5 8.3 8.9 12.7 15.9 11.8 6.5 7.7 10.6 19.1 9.5 What are the degrees of freedom? (numerator) (denominator)(c) Find the P-value of the sample test statistic. P-value > 0.100 0.050 < P-value < 0.100 0.025 < P-value < 0.050 0.010 < P-value < 0.025 0.001 < P-value < 0.010 P-value < 0.001 (d) Based on your answers in parts (a) to (c), will you reject or fail to reject the null hypothesis? Since the P-value is greater than the level of significance at α = 0.05, we do not reject H0. Since the P-value is less than or equal to the level of significance at α = 0.05, we…arrow_forwardTest for whether there has been a significant change in diabetes incidence over time.arrow_forward
- 130 adults with gum disease were asked the number of times per week they used to floss before their diagnoses. The (incomplete) results are shown below: # of times floss per week Frequency Relative Frequency Cumulative Frequency 18 0.1385 18 1 21 0.1615 39 2 20 59 3 15 0.1154 4 16 0.1231 90 10 0.0769 100 6 0.1231 116 7 14 0.1077 130 a. Complete the table (Use 4 decimal places when applicable) b. What is the cumulative relative frequency for flossing 5 times per week?arrow_forward#2...Can you write out answer please n thank uarrow_forward. A developmental psychologist would like to determine how much fine motor skill improves for children from age 3 to age 4. He takes a random sample of 9 three-year old children and gives each a manual dexterity test that measures fine motor skill. He tests these same children a year later, when they are each four-years old. Higher scores on this test indicate better fine motor skills. Scores are recorded in the table below. Is there a significant difference in the motor skills from age three to four? Test with an α = 0.05. What type of error is possible based on the outcome? What is the mean motor skill score for the children at age three? What is the mean motor skill score for the children at age four? Explain the advantage of using a dependent measures design over the independent measures design. What are some disadvantages?arrow_forward
arrow_back_ios
arrow_forward_ios
Recommended textbooks for you
- MATLAB: An Introduction with ApplicationsStatisticsISBN:9781119256830Author:Amos GilatPublisher:John Wiley & Sons Inc
 Probability and Statistics for Engineering and th...StatisticsISBN:9781305251809Author:Jay L. DevorePublisher:Cengage Learning
 Statistics for The Behavioral Sciences (MindTap C...StatisticsISBN:9781305504912Author:Frederick J Gravetter, Larry B. WallnauPublisher:Cengage Learning
  Elementary Statistics: Picturing the World (7th E...StatisticsISBN:9780134683416Author:Ron Larson, Betsy FarberPublisher:PEARSON
 The Basic Practice of StatisticsStatisticsISBN:9781319042578Author:David S. Moore, William I. Notz, Michael A. FlignerPublisher:W. H. Freeman
 Introduction to the Practice of StatisticsStatisticsISBN:9781319013387Author:David S. Moore, George P. McCabe, Bruce A. CraigPublisher:W. H. Freeman
MATLAB: An Introduction with Applications
Statistics
ISBN:9781119256830
Author:Amos Gilat
Publisher:John Wiley & Sons Inc
Probability and Statistics for Engineering and th...
Statistics
ISBN:9781305251809
Author:Jay L. Devore
Publisher:Cengage Learning
Statistics for The Behavioral Sciences (MindTap C...
Statistics
ISBN:9781305504912
Author:Frederick J Gravetter, Larry B. Wallnau
Publisher:Cengage Learning
Elementary Statistics: Picturing the World (7th E...
Statistics
ISBN:9780134683416
Author:Ron Larson, Betsy Farber
Publisher:PEARSON
The Basic Practice of Statistics
Statistics
ISBN:9781319042578
Author:David S. Moore, William I. Notz, Michael A. Fligner
Publisher:W. H. Freeman
Introduction to the Practice of Statistics
Statistics
ISBN:9781319013387
Author:David S. Moore, George P. McCabe, Bruce A. Craig
Publisher:W. H. Freeman