
FINANCIAL ACCOUNTING
10th Edition
ISBN: 9781259964947
Author: Libby
Publisher: MCG
expand_more
expand_more
format_list_bulleted
Related questions
Question

Transcribed Image Text:Home
Excel File Edit View
CP
Page Layout
J28
5
6
7
8
9
10
11
12
13
14
15
16
17
18
19
20
21
22
23
24
25
26
27
28
29
30
31
32
33
Paste
34
35
36
Insert
X
Calibri (Body)
B I U v
A
1
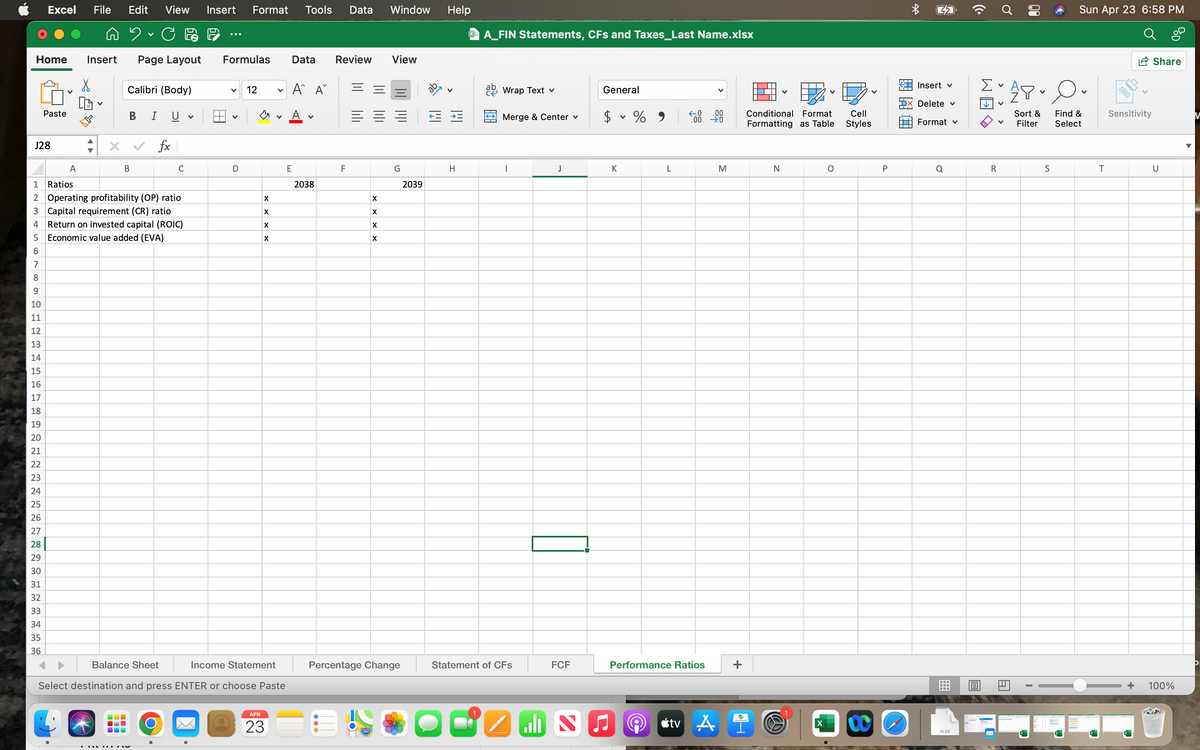
Ratios
2 Operating profitability (OP) ratio
3 Capital requirement (CR) ratio
4 Return on invested capital (ROIC)
Economic value added (EVA)
B
I
fx
Balance Sheet
TAAREDZAV
C
O
Insert Format Tools
Formulas Data Review
V 12
V
Income Statement
Select destination and press ENTER or choose Paste
D
X
X
X
X
V
APR
23
A^ A
A
E
V
2038
Data Window Help
F
=
X
X
X
X
280
View
G
Percentage Change
2039
H
XA_FIN Statements, CFs and Taxes_Last Name.xlsx
ab Wrap Text
Merge & Center ✓
I
Statement of CFs
الله
J
FCF
S
General
K
V
♫
%
L
500
Performance Ratios
.00
M
+
Conditional Format
Formatting as Table
tv A i
N
S
X
O
Cell
Styles
P
Greenwolde
4
Insert v
Delete v
Format v
Q
XLSX
((.
WE
R
V
E
Sun Apr 23 6:58 PM
8. Ou
Sort &
Filter
Find &
Select
S
T
Sensitivity
Share
U
+ 100%

Transcribed Image Text:A
1 Operating Capital
2 Net operating working capital
3 Long-term assets (Net FA)
4 Total operating capital
5
6
7 (million $)
9 NOPAT
8 Necessary investment in OP. Cap.
10 FCF
B
11
12
13
14
O
2038
X
X
X
X
X
X
2038
2039
80
70
120
20
2038
2039
420
540
EGE 11
X
X
600
800
X
X
1220
1430
X
X
4000
4820
1000
1320
3000
3500
4220
C
18
19 (million $)
20 Sales
21 COGS
22 Depreciation
23 Other expenses
24 Tot. op. costs
25 EBIT
26 Intrest expense
27 Pre-tax ernings
28
29 Taxes (25%)
30 Net Income
31
32
33
34
15
16 Income Statement (Millions of Dollars)
17
Tax Rate
D
E
F
2038
5,500
4500
300
350
5150
350
70
280
25%
70
210
G
2039
2039
6,000
5000
350
420
5770
230
120
110
25%
27.5
82.5
لاع
H
LO
I
Assets (million $)
Cash
Balance Sheet: Assets (Millions of Dollars)
S-T investment
Accounts receivable
Inventories
J
Total current assets (CA)
Gross fixed assets (FA)
Less: Depreciation
Net FA
Total assets
K
Liabilities and Equity (million $)
Accounts payable (A/P)
Notes payable
Accruals
Total current liabilities (CL)
Long-term dept
Total liabilities
Common Stock
Retained earnings
Total equity
Total L&E
L
M
N
P
2038
340
50
300
690
800
1490
1200
1730
2930
4420
4930
2039
440
250
340
1030
1100
2130
1200
1910
3110
5240
Q
R
S
T
U
Expert Solution
This question has been solved!
Explore an expertly crafted, step-by-step solution for a thorough understanding of key concepts.

Step by stepSolved in 3 steps

Knowledge Booster


Learn more about
Need a deep-dive on the concept behind this application? Look no further. Learn more about this topic, accounting and related others by exploring similar questions and additional content below.Similar questions
- A. 20Y5 Annual net cash flow is incorrect. B. Present value of annual net cash flow Less investment are incorrect. a. For each year, subtract the driver salaries and operating costs from the revenues. For 20Y3 only, add the residual value. b. Multiply the present value of $1 factor for each year by that year's net cash flow (from a). Subtract the amount to be invested from the total present value of the net cash flow.arrow_forwardWorking needarrow_forwardWhat is the annual after-tax operating cash flow? Table 3 Initial Equipment Project Life Sales Variable Costs Fixed Costs Tax rate Cost of Capital Ending Book Value Sales Price at Year 3 Net Working Capital $24,700 O $13,300 $32,250 $19,300 $55,000 3 Years $50,000 $20,000 $10,000 35% 10% $1,000 $20,000 $10,000arrow_forward
- Nonearrow_forwardThe following information pertains to Travis Concrete: Sales revenue $2,000,000 Gross margin 700,000 100,000 550,000 Income Invested capital The company's imputed interest rate is 8%. The capital turnover is: Multiple Choice 27.50. 3.64. 20.00.arrow_forwardHelp Saved ent i-Chapter 4O Provincial Inc. reported the following before-tax income statement itemns: $540, 000 Operating income Nonoperating losses (89,000) Provincial has a 25% income tax rate. Provincial would report the following amount of income tax expense as a separately stated line item in the income statement: Multiple Choice $11.000 Prev 1 of 15 Next >arrow_forward
- Gross Profit from Operations Tax Exempt Interest Capital gains Capital Loss carryforward Compensation expense Depreciation: Tax=$8,000/ E&P=$6,500 Other expenses Total Expense Book/ Taxable Income (1) Federal Income Tax (21%) Book Income $100,000 10,000 5,000 0 Total Income $115,000 $-12,000 30,000 6,000 10,000 46,000 (2) 69,000 M-1s 0 -10,000 0 -2000 0 2,000 0 2,000 -14,000 (3) Tax Income $100,000 0 5000 -2000 $103,000 30,000 8,000 10,000 48,000 55,000 0 After making your adjustments, what is ABC Corporation's current year E&P? (4) E&P Adjustment 0 0 n/a 0 0 n/a n/aarrow_forward($ thousands) Present value at 19% Net cash flow Net present value 0 1 4 -13,700 -1,594 -13,700 -1,339 3,541 (sum of PVs). Period 2 3 6 3,057 6,433 10,644 10,095 5,867 2,159 3,817 5,308 4,230 2,066 5 7 3,379 1,000 Restate the above net cash flows in real terms. Discount the restated cash flows at a real discount rate. Assume a 19% nominal rate and 11% expected inflation. NPV should be unchanged at +3,541, or $3,541,000. Note: Negative answers should be indicated by a minus sign. Do not round intermediate calculations. Enter your answers in thousands rounded to the nearest whole number. Year 0 Year 1 Year 2 Year 3 Year 4 Year 5 Year 6 Year 7 Real Net Cash Flows NPVarrow_forwardBaghibenarrow_forward
- Assignment: Chapter 11 Cost of Capital Attempts 2. An overview of a firm's cost of debt Keep the Highest/3 To calculate the after-tax cost of debt, multiply the before-tax cost of debt by Three Waters Company (TWC) can borrow funds at an interest rate of 12.50% (2+T)od of four years. Its marginal federal-plus-state tax rate is 40%. TWC's after-tax cost of debt is (rounded to two decimal(1-T) At the present time, Three Waters Company (TWC) has 10-year noncallable bonds with a face value of $1,000 that are outstanding. These bonds have a current market price of $1,278.41 per bond, carry a coupon rate of 11%, and distribute annual coupon payments. The company incurs a federal- plus-state tax rate of 40%. If TWC wants to issue new debt, what would be a reasonable estimate for its after-tax cost of debt (rounded to tw decimal places)? O4.22% O 3.80 % O 5.06% 4.85%arrow_forwardYears Revenue Cash Expense Book Depreciation Book Income Pre-Tax Book Tax at 32% After Tax Book Income Financial Measures Profit Margin % Net Assets ROA % Cashflow Revenue Cash Expense Tax Depreciation Pretax Income Tax at 32% After Tax Income After Tax Cashflow Cumulative Cashflow Payback Period Present Worth 10 PW12 PW15 IRR PV Index(15) Facility Cost Income Tax Rate 0 C. -9.5 d. -12.4 $ 100,000.00 2.2 Years 91740.92679 0.395702526 1 0.684350818 $ 100,000.00 32% $30,000.00 $100,000.00 $120,000.00 $140,000.00 $150,000.00 $150,000.00 $50,000.00 $60,000.00 $70,000.00 $75,000.00 $75,000.00 2 $20,000.00 $20,000.00 $20,000.00 $20,000.00 $20,000.00 $0.20 $20,400.00 $27,200.00 $0.26 $9,600.00 $12,800.00 $16,000.00 $17,600.00 $17,600.00 $20,400.00 ($100,000.00) $40,400.00 $51,040.00 ($100,000.00) -$59,600.00 -$8,560.00 $40,000.00 $50,000.00 $55,000.00 $55,000.00 $0.23 3 $0.45 $36,727.27 $80,000.00 $60,000.00 $40,000.00 $20,000.00 $0.85 $1.87 4 $19,040.00 5 $34,000.00 $37,400.00 $0.24…arrow_forward5 Edmonds Industries is forecasting the following income statement: Sales Operating costs (excl. Depr. & Amort.) EBITDA Depreciation EBIT Interest EBT Taxes (40%) Net income $10,000,000 5,500,000 4,500,000 1,200,000 $ 3,300,000 500,000 $ 2,800,000 1,120,000 $ 1,680,000 The CEO would like to see higher sales and a forecasted net income of $2,100,000. Assume that operating costs (excluding depreciation and amortization) are 55% of sales and that depreciation and amortization and interest expenses will increase by 6%. The tax rate, which is 40%, will remain the same. (Note that while the tax rate remains constant, the taxes paid will change.) What level of sales would generate $2,100,000 in net income?arrow_forward
arrow_back_ios
arrow_forward_ios
Recommended textbooks for you
 AccountingAccountingISBN:9781337272094Author:WARREN, Carl S., Reeve, James M., Duchac, Jonathan E.Publisher:Cengage Learning,
 Accounting Information SystemsAccountingISBN:9781337619202Author:Hall, James A.Publisher:Cengage Learning,
 Horngren's Cost Accounting: A Managerial Emphasis...AccountingISBN:9780134475585Author:Srikant M. Datar, Madhav V. RajanPublisher:PEARSON
 Intermediate AccountingAccountingISBN:9781259722660Author:J. David Spiceland, Mark W. Nelson, Wayne M ThomasPublisher:McGraw-Hill Education
 Financial and Managerial AccountingAccountingISBN:9781259726705Author:John J Wild, Ken W. Shaw, Barbara Chiappetta Fundamental Accounting PrinciplesPublisher:McGraw-Hill Education
Accounting
Accounting
ISBN:9781337272094
Author:WARREN, Carl S., Reeve, James M., Duchac, Jonathan E.
Publisher:Cengage Learning,
Accounting Information Systems
Accounting
ISBN:9781337619202
Author:Hall, James A.
Publisher:Cengage Learning,
Horngren's Cost Accounting: A Managerial Emphasis...
Accounting
ISBN:9780134475585
Author:Srikant M. Datar, Madhav V. Rajan
Publisher:PEARSON
Intermediate Accounting
Accounting
ISBN:9781259722660
Author:J. David Spiceland, Mark W. Nelson, Wayne M Thomas
Publisher:McGraw-Hill Education
Financial and Managerial Accounting
Accounting
ISBN:9781259726705
Author:John J Wild, Ken W. Shaw, Barbara Chiappetta Fundamental Accounting Principles
Publisher:McGraw-Hill Education