
MATLAB: An Introduction with Applications
6th Edition
ISBN: 9781119256830
Author: Amos Gilat
Publisher: John Wiley & Sons Inc
expand_more
expand_more
format_list_bulleted
Related questions
Concept explainers
Question
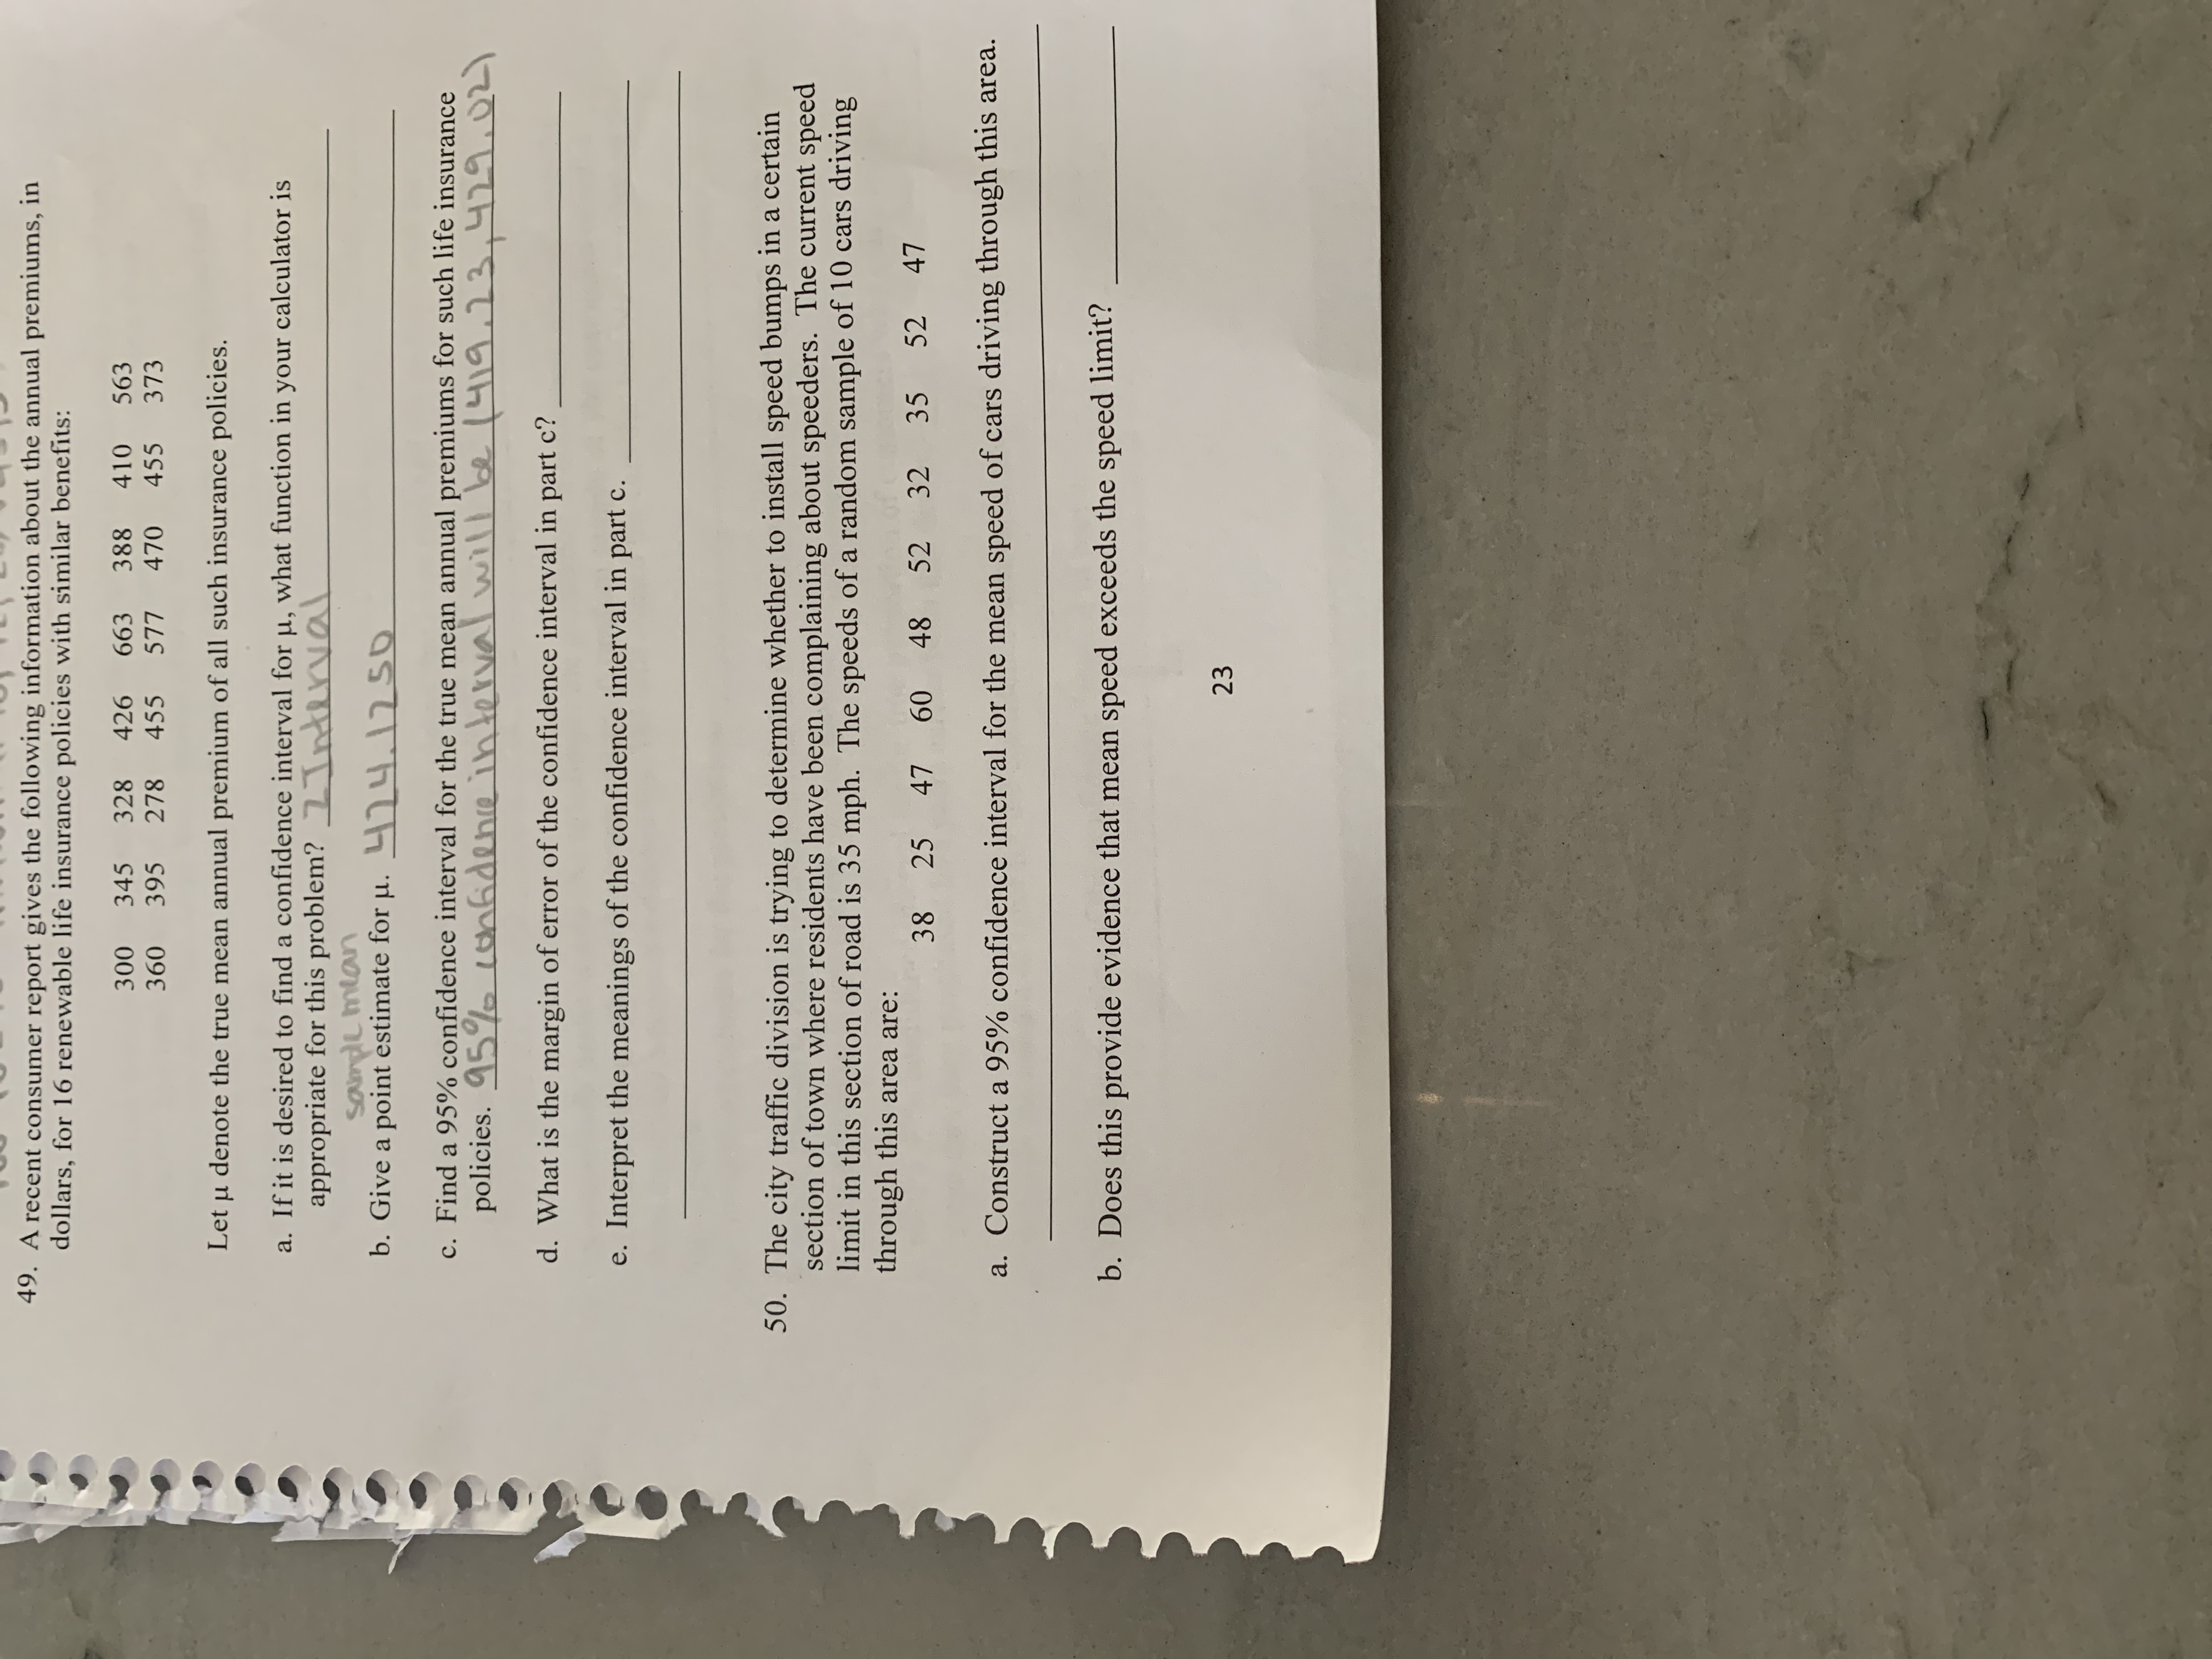

Transcribed Image Text:49. A recent consumer report gives the following information about the annual premiums, in
dollars, for 16 renewable life insurance policies with similar benefits:
300 345 328
426
663 388
410 563
360
395 278 455
577 470 455 373
Let µ denote the true mean annual premium of all such insurance policies.
a. If it is desired to find a confidence interval for µ, what function in your calculator is
appropriate for this problem? 1nterval
SamdL mlan
b. Give a point estimate for µ. 4 4.1250
c. Find a 95% confidence interval for the true mean annual premiums for such life insurance
policies. 95% Lonfidence in terval will be 1419.23,429.021
d. What is the margin of error of the confidence interval in part c?
e. Interpret the meanings of the confidence interval in part c.
Expert Solution
This question has been solved!
Explore an expertly crafted, step-by-step solution for a thorough understanding of key concepts.

This is a popular solution

Trending nowThis is a popular solution!

Step by stepSolved in 5 steps with 2 images

Knowledge Booster


Learn more about
Need a deep-dive on the concept behind this application? Look no further. Learn more about this topic, statistics and related others by exploring similar questions and additional content below.Similar questions
- The number of heart surgeries performed at a hospital has increased over the past several years. The hospital’s administration is seeking the best method to forecast the demand for such surgeries in Year 6. The data for the past five years is shown. Year Demand 1 130 2 139 3 135 4 144 5 141 The hospital is considering the following forecasting methods. Compare the performance of these methods using the mean squared error (MSE). Begin error measurements in year 3 so all methods are compared for the same years. Exponential smoothing, with α = 0.5. let the initial forecast for year 1= 130, the same as the actual demand. Two-year simple moving average Two-year weighted moving average, using weights 0.7 and 0.3, with more recent data given more weight. Solve this problem on a separate paper. Then, use the results to complete the tables provided below, save the file and then submit it on E-learning. 1- Exponential smoothing: Year Forecast…arrow_forwardA random sample of 76 eighth-grade students' scores on a national mathematics assessment test has a mean score of 273. This test result prompts a state school administrator to declare that the mean score for the state's eighth graders on this exam is more than 270. Assume that the population standard deviation is 33. At α=0.02, is there enough evidence to support the administrator's claim? Complete parts (a) through (e). Part 1 (a) Write the claim mathematically and identify H0 and Ha. Choose the correct answer below. A.) H0: μ≥270 (claim) Ha: μ<270 B.) H0: μ≤270 (claim) Ha: μ>270 C.) H0: μ=270 (claim) Ha: μ>270 D.) H0:μ≤270 Ha: μ>270 (claim) E.) H0: μ<270 Ha: μ≥270 (claim) F.) H0: μ=270 Ha: μ>270 (claim) (b) Find the standardized z, and its coresponding area z=_____ (c) Find the P-value P-value =_____ (d) Decide whether to reject or fail the null…arrow_forward1. Describe the key features of the normal curve and explain why the normal curve in real-life distributions nevermatches the model perfectly.arrow_forward
- Data can be approximated quite well by a N(3.4, 3.1) model. Economists become alarmed when productivity decreases. According to the normal model what is the probability that the percent change in worker output per hour from the previous quarter is more than 1.6 standard deviations below the mean? What is the probability that the percent change in worker output from the previous quarter is between -1.56 and 4.33?arrow_forwardWhy can’t the following mode predict 100% of the variability in the price of a used Corolla?arrow_forwardSuppose that the recovery time from the infection with a certain virus is normally distributed with a mean of 6.5 days and a standard deviation of 1.5 days. Answer each question. Draw a graph illustrating the recovery time. Make sure to indicate 3 standard deviations from the mean. P(X>7.3)=? P(X <4.7)=? P(5.1<X<7.7)=? John's recovery time is lasting more than 9.2 days. Is it unusual (and should he be concerned yet)? What is the middle 90% recovery time? What is the 80%tile recovery time?arrow_forward
- I need help to solve this question.arrow_forwardListed below, from left to right and then top to bottom, are numbers of law enforcement fatalities for 20 recent and consecutive years. First find the mean, identify each value as being above the mean (A) or below the mean (B), then test for randomness above and below the mean using α = 0.05. Is there a trend? 183 140 173 172 144 163 242 159 150 165 164 155 191 147 124 160 171 125 106 116 The mean is. (Type an integer or a decimal. Do not round.) Carrow_forward9.17arrow_forward
- Parts a, b, and d and explian how it was done. DON'T USE EXCEL, please do the work manually if you canarrow_forwardI attached.arrow_forwardCalcium is essential to tree growth. In 1990, the concentration of calcium in precipitation in a certain area was 0.11milligrams per liter (mg/L).A random sample of 10 precipitation dates in 2018 results in the following data table. Complete parts (a) through (c) below. (B) With 98% confidence, the mean concentration of calcium in precipitation in this area in 2018 is betweenarrow_forward
arrow_back_ios
arrow_forward_ios
Recommended textbooks for you
- MATLAB: An Introduction with ApplicationsStatisticsISBN:9781119256830Author:Amos GilatPublisher:John Wiley & Sons Inc
 Probability and Statistics for Engineering and th...StatisticsISBN:9781305251809Author:Jay L. DevorePublisher:Cengage Learning
 Statistics for The Behavioral Sciences (MindTap C...StatisticsISBN:9781305504912Author:Frederick J Gravetter, Larry B. WallnauPublisher:Cengage Learning
  Elementary Statistics: Picturing the World (7th E...StatisticsISBN:9780134683416Author:Ron Larson, Betsy FarberPublisher:PEARSON
 The Basic Practice of StatisticsStatisticsISBN:9781319042578Author:David S. Moore, William I. Notz, Michael A. FlignerPublisher:W. H. Freeman
 Introduction to the Practice of StatisticsStatisticsISBN:9781319013387Author:David S. Moore, George P. McCabe, Bruce A. CraigPublisher:W. H. Freeman
MATLAB: An Introduction with Applications
Statistics
ISBN:9781119256830
Author:Amos Gilat
Publisher:John Wiley & Sons Inc
Probability and Statistics for Engineering and th...
Statistics
ISBN:9781305251809
Author:Jay L. Devore
Publisher:Cengage Learning
Statistics for The Behavioral Sciences (MindTap C...
Statistics
ISBN:9781305504912
Author:Frederick J Gravetter, Larry B. Wallnau
Publisher:Cengage Learning
Elementary Statistics: Picturing the World (7th E...
Statistics
ISBN:9780134683416
Author:Ron Larson, Betsy Farber
Publisher:PEARSON
The Basic Practice of Statistics
Statistics
ISBN:9781319042578
Author:David S. Moore, William I. Notz, Michael A. Fligner
Publisher:W. H. Freeman
Introduction to the Practice of Statistics
Statistics
ISBN:9781319013387
Author:David S. Moore, George P. McCabe, Bruce A. Craig
Publisher:W. H. Freeman