
MATLAB: An Introduction with Applications
6th Edition
ISBN: 9781119256830
Author: Amos Gilat
Publisher: John Wiley & Sons Inc
expand_more
expand_more
format_list_bulleted
Related questions
Question
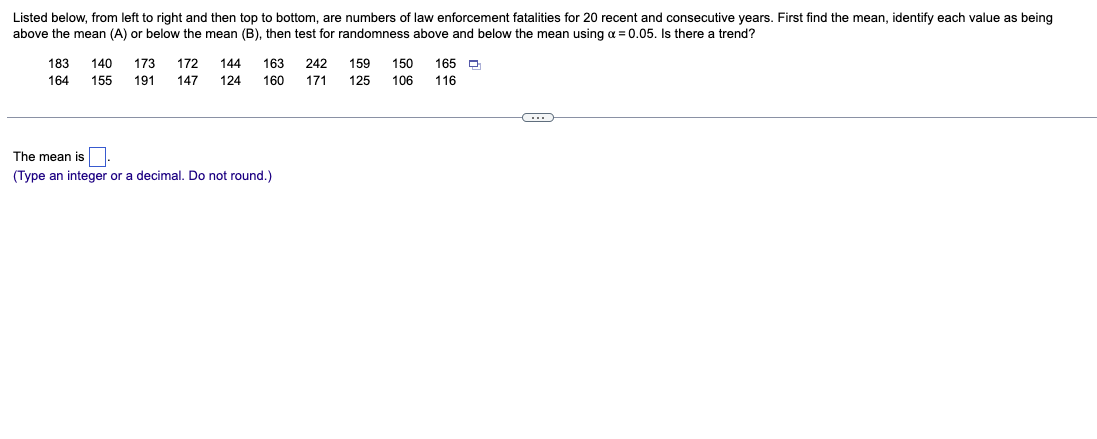

Transcribed Image Text:Listed below, from left to right and then top to bottom, are numbers of law enforcement fatalities for 20 recent and consecutive years. First find the mean, identify each value as being
above the mean (A) or below the mean (B), then test for randomness above and below the mean using α = 0.05. Is there a trend?
183 140 173 172 144 163 242 159 150 165
164 155 191 147 124 160 171 125 106 116
The mean is.
(Type an integer or a decimal. Do not round.)
C
Expert Solution
This question has been solved!
Explore an expertly crafted, step-by-step solution for a thorough understanding of key concepts.

Step by stepSolved in 2 steps with 1 images

Follow-up Questions
Read through expert solutions to related follow-up questions below.
Follow-up Question

Transcribed Image Text:Listed below, from left to right and then top to bottom, are numbers of law enforcement fatalities for 20 recent and consecutive years. First find the mean, identify each value as being
above the mean (A) or below the mean (B), then test for randomness above and below the mean using α = 0.05. Is there a trend?
183 140 173 172
164
144 163 242 159 150
155 191 147 124 160 171 125 106
The mean is 157.5.
(Type an integer or a decimal. Do not round.)
Determine the null and alternative hypotheses.
Ho: The data are in a random order.
H₁: The data are in an order that is not random.
Determine the test statistic.
(Type an integer or decimal rounded to two decimal places as needed.)
165 ₁
116
Solution
by Bartleby Expert
Follow-up Questions
Read through expert solutions to related follow-up questions below.
Follow-up Question
Transcribed Image Text:Listed below, from left to right and then top to bottom, are numbers of law enforcement fatalities for 20 recent and consecutive years. First find the mean, identify each value as being
above the mean (A) or below the mean (B), then test for randomness above and below the mean using α = 0.05. Is there a trend?
183 140 173 172
164
144 163 242 159 150
155 191 147 124 160 171 125 106
The mean is 157.5.
(Type an integer or a decimal. Do not round.)
Determine the null and alternative hypotheses.
Ho: The data are in a random order.
H₁: The data are in an order that is not random.
Determine the test statistic.
(Type an integer or decimal rounded to two decimal places as needed.)
165 ₁
116
Solution
by Bartleby Expert
Knowledge Booster

Similar questions
- Evaluate In(300.6). Give your answer to 4 decimal places. In(300.6)arrow_forwardJohn's answering machine receives about 28 telephone calls between 8:00 am and 8:00 pm. Let X = the number of phone calls received between 1:00 pm to 3:00 pm. What is the mean of X?arrow_forwardThe inner radius of the washer is r,: x and the outer radius is r, = Submit Skip (you cannot come back).arrow_forward
- For the data in the table, find the mean and the median of the monthly high temperatures. Then do the same for the monthly low temperatures. The mean of the high temperatures is ______F (type an integer or a decimal.) Month High low Jan 17 8 Feb 23 13 Mar 30 19 Temperatures are in degrees fahrenheit Apr 41 28 May 54 43arrow_forwardChris is asked to find a geometric mean in JKL what is his error?arrow_forwardA college chemistry instructor thinks the use of embedded tutors will improve the success rate in introductory chemistry courses. The passing rate for introductory chemistry is 73%. During one semester, 200 students were enrolled in introductory chemistry courses with an embedded tutor. Of these 200 students, 162 passed the course. The instructor carried out a hypothesis test and found that the observed value of the test statistic was 2.55. The p-value associated with this test statistic is 0.0054. Explain the meaning of the p-value in this context. Based on this result, should the instructor believe the success rate has improved? State the hypotheses that were used for the test Choose the correct answer below. OA. Ho: p=0.73 and Ha: p>0.73 OB. Ho: p0.73 OC. Ho p=0.73 and Ha: p0.73 and Ha: p<0.73 OE. Ho: p=0.73 and Ha: p# 0.73 Explain the meaning of the p-value in this context. Select the correct choice below and fill in the answer box within your choice. (Type an integer or a decimal.…arrow_forward
arrow_back_ios
arrow_forward_ios
Recommended textbooks for you
- MATLAB: An Introduction with ApplicationsStatisticsISBN:9781119256830Author:Amos GilatPublisher:John Wiley & Sons Inc
 Probability and Statistics for Engineering and th...StatisticsISBN:9781305251809Author:Jay L. DevorePublisher:Cengage Learning
 Statistics for The Behavioral Sciences (MindTap C...StatisticsISBN:9781305504912Author:Frederick J Gravetter, Larry B. WallnauPublisher:Cengage Learning
  Elementary Statistics: Picturing the World (7th E...StatisticsISBN:9780134683416Author:Ron Larson, Betsy FarberPublisher:PEARSON
 The Basic Practice of StatisticsStatisticsISBN:9781319042578Author:David S. Moore, William I. Notz, Michael A. FlignerPublisher:W. H. Freeman
 Introduction to the Practice of StatisticsStatisticsISBN:9781319013387Author:David S. Moore, George P. McCabe, Bruce A. CraigPublisher:W. H. Freeman
MATLAB: An Introduction with Applications
Statistics
ISBN:9781119256830
Author:Amos Gilat
Publisher:John Wiley & Sons Inc
Probability and Statistics for Engineering and th...
Statistics
ISBN:9781305251809
Author:Jay L. Devore
Publisher:Cengage Learning
Statistics for The Behavioral Sciences (MindTap C...
Statistics
ISBN:9781305504912
Author:Frederick J Gravetter, Larry B. Wallnau
Publisher:Cengage Learning
Elementary Statistics: Picturing the World (7th E...
Statistics
ISBN:9780134683416
Author:Ron Larson, Betsy Farber
Publisher:PEARSON
The Basic Practice of Statistics
Statistics
ISBN:9781319042578
Author:David S. Moore, William I. Notz, Michael A. Fligner
Publisher:W. H. Freeman
Introduction to the Practice of Statistics
Statistics
ISBN:9781319013387
Author:David S. Moore, George P. McCabe, Bruce A. Craig
Publisher:W. H. Freeman