ENGR.ECONOMIC ANALYSIS
14th Edition
ISBN: 9780190931919
Author: NEWNAN
Publisher: Oxford University Press
expand_more
expand_more
format_list_bulleted
Question

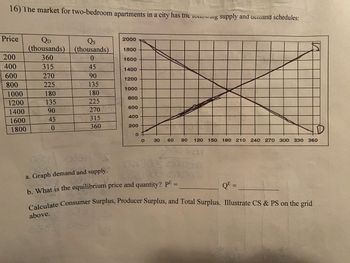
Transcribed Image Text:16) The market for two-bedroom apartments in a city has the onowing supply and acmand schedules:
Price
200
400
600
800
1000
1200
1400
1600
1800
QD
(thousands)
360
315
270
225
180
135
90
45
0
Qs
(thousands)
0
45
90
135
180
225
270
315
360
2000
1800
1600
1400
1200
1000
800
600
400
200
0
O
30 60 90 120 150 180 210 240 270 300 330 360
Ca
a. Graph demand and supply.
b. What is the equilibrium price and quantity? PE =
460 270000
QE =
Calculate Consumer Surplus, Producer Surplus, and Total Surplus. Illustrate CS & PS on the grid
above.
036
Expert Solution
This question has been solved!
Explore an expertly crafted, step-by-step solution for a thorough understanding of key concepts.
Step by stepSolved in 5 steps with 10 images

Knowledge Booster
Learn more about
Need a deep-dive on the concept behind this application? Look no further. Learn more about this topic, economics and related others by exploring similar questions and additional content below.Similar questions
- Hand written solutions are strictly prohibitedarrow_forwardUse the black point (plus symbol) to indicate the equilibrium price and quantity of VR headsets. Then use the green point (triangle symbol) to fill the area representing consumer surplus, and use the purple point (diamond symbol) to fill the area representing producer surplus. (?) PRICE (Dollars per headset) 350 315 280 245 210 175 140 105 70 35 0 0 Demand Supply 85 170 255 340 425 510 595 680 765 850 QUANTITY (Millions of headsets) Total surplus in this market is $ million. + Equilibrium Δ Consumer Surplus Producer Surplusarrow_forwardConsider a market for fountain pens. Suppose the ink (complement for fountain pens) becomes more expensive. What is going to happen to producer surplus on the fountain pens market? Producer surplus will increase Producer surplus will decrease Producer surplus will stay the same Change in producer surplus will be ambiguousarrow_forward
- The figure below shows the situation of a market. What is the equailibrim price and answer the consumer surplus and producer surplus at the equilibrium price.arrow_forwardThe demand for pizza is represented by P^D=10-(Q^D/4), and the supply of pizza is represented by P^S=4+(Q^S/2), with Q in thousands and P in dollars. The market for pizza is perfectly competitive. Suppose a price ceiling was set $2 below the equilibrium price. What would be the result? A. There would be a surplus of 12000. B. Quantity demanded would equal 4000. C. This is a nonbinding price ceiling. D. There would be a shortage of 12000.arrow_forwardEconomicarrow_forward
- Consider the following market for a good that is initially produced and sold in a perfectly competitive market. Price PPC Pceiling A C E B D Qceiling QPC Supply Demand Quantity Select all that apply. For example, if you believe the change to consumer surplus is characterized by (+ D - E), you must select two boxes: the one for "+D" and another box for "-E". When the government imposes a price celing, the change in consumer surplus is:arrow_forward$ If demand is P = 100 - 2Q and supply is P = 20 + 3Q, what is the value of the Producer Surplus? Enter as a value. Next ▸arrow_forwardIn graph A below shows the market demand and supply in a competitive market, and graph B shows the cost curves of a representative firm in that industry. a. What are the market equilibrium price and quantity? Equilibrium price: $ Quantity traded:b. At equilibrium, what quantity is the firm producing? What is its total profit or loss? Leave no cells blank - be certain to enter "0" wherever required. Quantity: Total profit or loss $arrow_forward
- not use ai pleasearrow_forwardUsing the demand and supply graph given below, explain the impact of the ban in the market for cigarettes.arrow_forwardQUESTION 1 Given a demand curve of P = 181 - 5Qd and supply of P = 29 + 9Qs, please calculate producer surplus, assuming this is the output marketarrow_forward
arrow_back_ios
SEE MORE QUESTIONS
arrow_forward_ios
Recommended textbooks for you

 Principles of Economics (12th Edition)EconomicsISBN:9780134078779Author:Karl E. Case, Ray C. Fair, Sharon E. OsterPublisher:PEARSON
 Engineering Economy (17th Edition)EconomicsISBN:9780134870069Author:William G. Sullivan, Elin M. Wicks, C. Patrick KoellingPublisher:PEARSON
 Principles of Economics (MindTap Course List)EconomicsISBN:9781305585126Author:N. Gregory MankiwPublisher:Cengage Learning
 Managerial Economics: A Problem Solving ApproachEconomicsISBN:9781337106665Author:Luke M. Froeb, Brian T. McCann, Michael R. Ward, Mike ShorPublisher:Cengage Learning
 Managerial Economics & Business Strategy (Mcgraw-...EconomicsISBN:9781259290619Author:Michael Baye, Jeff PrincePublisher:McGraw-Hill Education


Principles of Economics (12th Edition)
Economics
ISBN:9780134078779
Author:Karl E. Case, Ray C. Fair, Sharon E. Oster
Publisher:PEARSON

Engineering Economy (17th Edition)
Economics
ISBN:9780134870069
Author:William G. Sullivan, Elin M. Wicks, C. Patrick Koelling
Publisher:PEARSON

Principles of Economics (MindTap Course List)
Economics
ISBN:9781305585126
Author:N. Gregory Mankiw
Publisher:Cengage Learning

Managerial Economics: A Problem Solving Approach
Economics
ISBN:9781337106665
Author:Luke M. Froeb, Brian T. McCann, Michael R. Ward, Mike Shor
Publisher:Cengage Learning

Managerial Economics & Business Strategy (Mcgraw-...
Economics
ISBN:9781259290619
Author:Michael Baye, Jeff Prince
Publisher:McGraw-Hill Education