
Practical Management Science
6th Edition
ISBN: 9781337406659
Author: WINSTON, Wayne L.
Publisher: Cengage,
expand_more
expand_more
format_list_bulleted
Related questions
Question
thumb_up100%
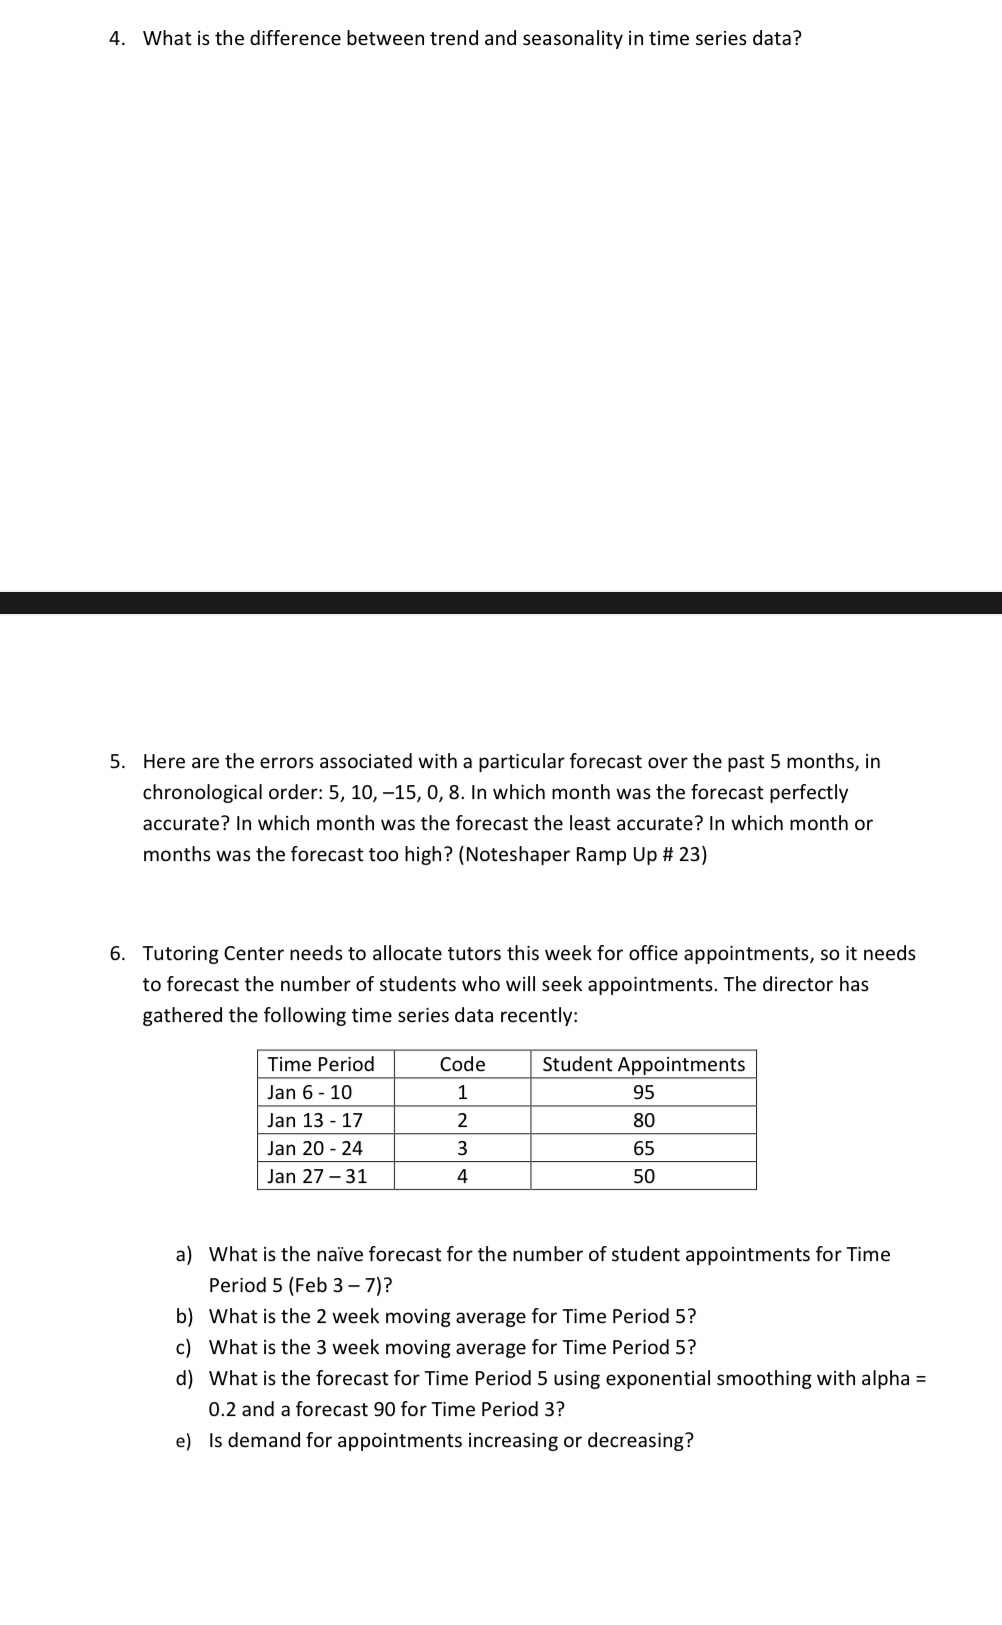

Transcribed Image Text:4. What is the difference between trend and seasonality in time series data?
5. Here are the errors associated with a particular forecast over the past 5 months, in
chronological order: 5, 10, -15, 0, 8. In which month was the forecast perfectly
accurate? In which month was the forecast the least accurate? In which month or
months was the forecast too high? (Noteshaper Ramp Up # 23)
6. Tutoring Center needs to allocate tutors this week for office appointments, so it needs
to forecast the number of students who will seek appointments. The director has
gathered the following time series data recently:
Time Period
Code
Student Appointments
Jan 6 - 10
95
Jan 13 - 17
80
Jan 20 - 24
65
Jan 27 – 31
4
50
a) What is the naïve forecast for the number of student appointments for Time
Period 5 (Feb 3– 7)?
b) What is the 2 week moving average for Time Period 5?
c) What is the 3 week moving average for Time Period 5?
d) What is the forecast for Time Period 5 using exponential smoothing with alpha =
0.2 and a forecast 90 for Time Period 3?
e) Is demand for appointments increasing or decreasing?
Expert Solution
This question has been solved!
Explore an expertly crafted, step-by-step solution for a thorough understanding of key concepts.

This is a popular solution

Trending nowThis is a popular solution!

Step by stepSolved in 2 steps

Knowledge Booster

Similar questions
- 14.5. For the data in Exercise 14.4, use an a of 0.1 to make a forecast for July F Ft-1 + 0.1(At-1-Ft-1) Months January 15 February 18 March 22 23 27 26 April May June Demand Smoothing unit (At) (St) July 15 15.3 15.97 16.67 17.7 18.53 Forecast for July= 18.53 Forecast (Ft) 15 15.3 15.97 16.67 17.7 18.53arrow_forwardeBook Problem 6-05 Consider the following time series data. 3 16 Week 1 Week 2 Value 18 13 a. Choose the correct time series plot (1) € (!!!) Time Series Value Time Series Value 28642986420 284H2G86420 1 4 11 2 {B} 2 TH 3 Week (t) Week (t) 5 6 € (iv) Time Series Value Time Series Value 28642 NO 28642 NO 1 2 2 4 3₁ Week (t) Week (t) 5 6arrow_forwardHere are the errors associated with a particular forecast over the past five months, in chronological order: 2, 5, 0, -5, -10. Which of the following statements is (are) true? I. The forecast was too high during the fifth month. II. The mean error over these five months is -2. III. The forecast was perfectly accurate during one of the months. a. I only Ob. Il only O. Il only d. I and III Oe.I, Il and IIarrow_forward
- A forecast for the first six months of the year revealed a tendency to underpredict the actual demand for the revitalized Hubig’s Pies plant in the Marigny. Month Actual Forecast January 675 600 February 720 700 March 640 620 April 510 495 May 480 410 June 565 535 What is the mean squared error of this forecast? a. 1,694 b. 1,873 c. 2,075 d. 1,469arrow_forwardNonearrow_forwardPlease do not give solution in image format thankuarrow_forward
- Here are the data for the past 21 months for actual sales of a particular product: LAST YEAR THIS YEAR January 315 February 418 March 390 April 430 May 400 [ June 480 July 430 August 320 September 385 October 530 November 592 555 December 300 400 350 460 390 395 355 245 340 Develop a forecast for the fourth quarter using a three-quarter, weighted moving average. Weight the most recent quarter 0.50, the second most recent 0.25, and the third 0.25. Do the problem using quarters, as opposed to forecasting separate months. (Round your answer to 2 decimal places.) Forecast for the fourth quarterarrow_forwardTo have a stable forecasting tool when using the simple moving average method, what value of N (the number of periods) should a firm choose among the following choices? a. 3b. 2c. 8d. 6arrow_forward7. Tim Hortons is planning to expand a new emarket by opening 6 branches . What are the 2 possible forecasting strategies that this company may implement. * Enter your answerarrow_forward
- Here are the actual tabulated demands for an item for a nine-month period (January through September). Your supervisor wants to test two moving average forecasting methods to see which one was better over this period. Month Actual Demand Jan 120 Feb 140 March 160 April 180 May 170 June 190 July 150 August 160 September 170 a. Forecast April through September using a three-month moving average and calculate MAD for the forecasts. b. Forecast May through September using a four-month moving average and calculate MAD for the forecasts.arrow_forwardDon't use Aiarrow_forwardGive typed explanation Part 2: Using exponential smoothing, the forecasted demand for period 5 using the smoothing constant determined in image= ?arrow_forward
arrow_back_ios
SEE MORE QUESTIONS
arrow_forward_ios
Recommended textbooks for you
- Practical Management ScienceOperations ManagementISBN:9781337406659Author:WINSTON, Wayne L.Publisher:Cengage,
 Operations ManagementOperations ManagementISBN:9781259667473Author:William J StevensonPublisher:McGraw-Hill Education
 Operations and Supply Chain Management (Mcgraw-hi...Operations ManagementISBN:9781259666100Author:F. Robert Jacobs, Richard B ChasePublisher:McGraw-Hill Education
 Purchasing and Supply Chain ManagementOperations ManagementISBN:9781285869681Author:Robert M. Monczka, Robert B. Handfield, Larry C. Giunipero, James L. PattersonPublisher:Cengage Learning
 Production and Operations Analysis, Seventh Editi...Operations ManagementISBN:9781478623069Author:Steven Nahmias, Tava Lennon OlsenPublisher:Waveland Press, Inc.
Practical Management Science
Operations Management
ISBN:9781337406659
Author:WINSTON, Wayne L.
Publisher:Cengage,
Operations Management
Operations Management
ISBN:9781259667473
Author:William J Stevenson
Publisher:McGraw-Hill Education
Operations and Supply Chain Management (Mcgraw-hi...
Operations Management
ISBN:9781259666100
Author:F. Robert Jacobs, Richard B Chase
Publisher:McGraw-Hill Education
Purchasing and Supply Chain Management
Operations Management
ISBN:9781285869681
Author:Robert M. Monczka, Robert B. Handfield, Larry C. Giunipero, James L. Patterson
Publisher:Cengage Learning
Production and Operations Analysis, Seventh Editi...
Operations Management
ISBN:9781478623069
Author:Steven Nahmias, Tava Lennon Olsen
Publisher:Waveland Press, Inc.