
ENGR.ECONOMIC ANALYSIS
14th Edition
ISBN: 9780190931919
Author: NEWNAN
Publisher: Oxford University Press
expand_more
expand_more
format_list_bulleted
Related questions
Question
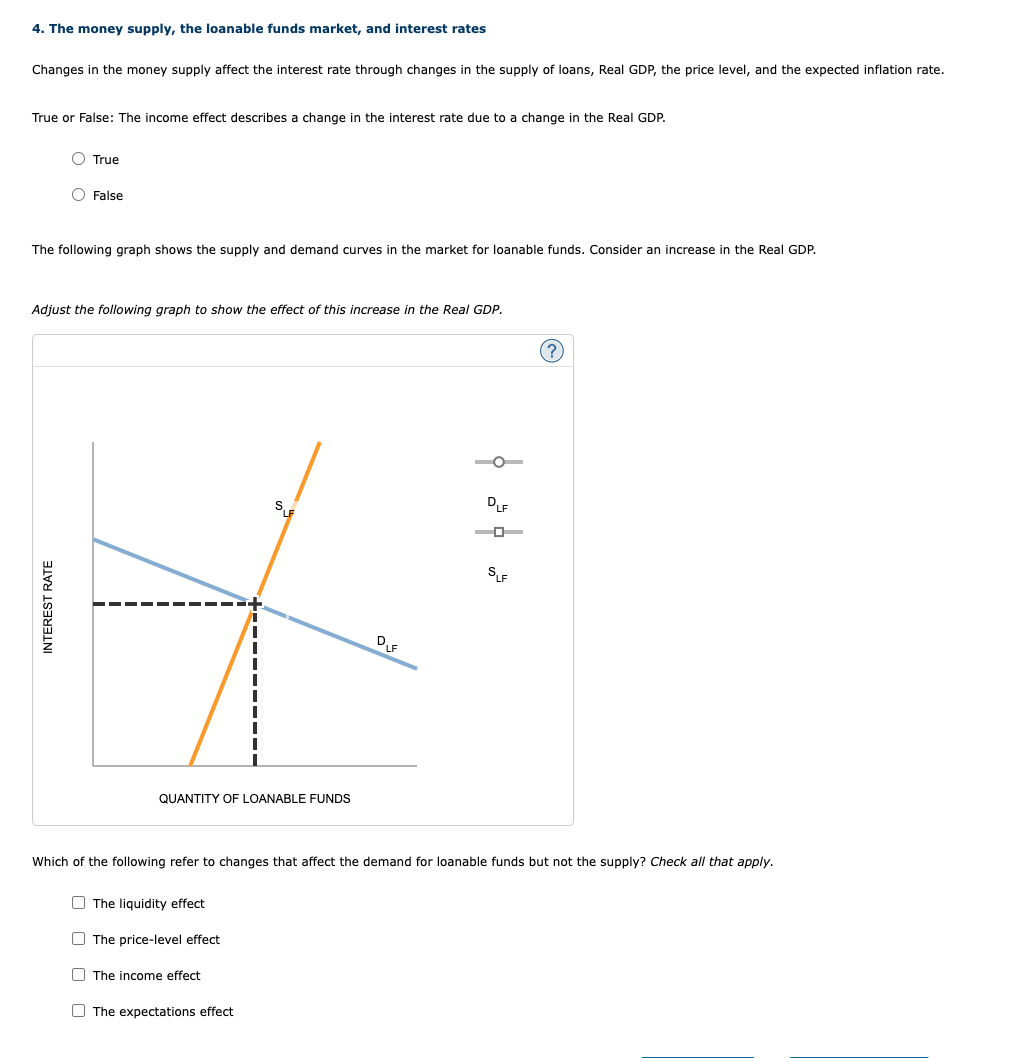

Transcribed Image Text:4. The money supply, the loanable funds market, and interest rates
Changes in the money supply affect the interest rate through changes in the supply of loans, Real GDP, the price level, and the expected inflation rate.
True or False: The income effect describes a change in the interest rate due to a change in the Real GDP.
True
O False
The following graph shows the supply and demand curves in the market for loanable funds. Consider an increase in the Real GDP.
INTEREST RATE
Adjust the following graph to show the effect of this increase in the Real GDP.
QUANTITY OF LOANABLE FUNDS
The liquidity effect
The price-level effect
SLE
The income effect
The expectations effect
DLF
ܘ ܘ
Which of the following refer to changes that affect the demand for loanable funds but not the supply? Check all that apply.
DLF
SLF
(?)
Expert Solution
This question has been solved!
Explore an expertly crafted, step-by-step solution for a thorough understanding of key concepts.

This is a popular solution

Trending nowThis is a popular solution!

Step by stepSolved in 6 steps with 2 images

Knowledge Booster


Learn more about
Need a deep-dive on the concept behind this application? Look no further. Learn more about this topic, economics and related others by exploring similar questions and additional content below.Similar questions
- Macmillan Learning U The graph depicts the market for loanable funds. Shift the appropriate curves to indicate what will happen to the market if there is an improvement in the technology firms use in production. As a result of this change, the real interest rate is now % Real interest rate 5.0 4.5 4.0 3.5 3.0 2.5 2.0 1.5 1.0 and the quantity of funds is $ billion. 0.5 Supply Demand 0.0 0 5 10 15 20 25 30 35 40 45 50 Loanable funds (in billions)arrow_forwardK Consider the graph to answer the following questions: a. The shift from S, to S₂ represents in the supply of loanable funds. b. With the shift in supply, the equilibrium quantity of loanable funds c. With the change in the equilibrium quantity of loanable funds, the quantity of saving and the quantity of investment ▼ A CI Real Interest Rate Market for Loanable Funds L₂ L1 Loanable Funds ($ per year) S₁ Qarrow_forwardInterest Rate% 12% 10% 8% 6% 4% 2% 0 5 10 15 20 25 30 35 40 45 50 Supply of Savings Select one: a. The economic dips into a recession and firms see profits fall b. Firms become more optimistic about their expected profits c. An increase in business taxes d. A decrease in household wealth Quantity of loanable funds (billions) Refer to the graph above. Which of the following would cause interest rates to increase? Ti Demand for Borrowingarrow_forward
- PLEASE ANSWER ALL QUESTIONS NOT JUST SOME PLEASE WRITE THE EXACT NUMBERS FOR THE GRAPH. PLEASE READ CAREFULLY, THIS MAY BE A SIMILAR QUESTION, BUT ALL QUESTIONS ARE DIFFERENTarrow_forwardMjarrow_forward8 Demand, Supply 7 10 4 REAL INTEREST RATE (Percent) 3 2 - 10 20 30 40 50 60 70 80 QUANTITY OF LOANABLE FUNDS (Billions of dollars) Refer to Figure 33-1. If the real interest rate is 3 percent, the quantity of loanable funds demanded is $50 billion, and the quantity supplied is $30 billion. $20 billion, and the quantity supplied is $60 billion. $50 billion, and the quantity supplied is $60 billion. $30 billion, and the quantity supplied is $50 billion.arrow_forward
- 5. The market for loanable funds and government policy The following graph shows the market for loanable funds. For each of the given scenarios, adjust the appropriate curve on the graph to help you complete the questions that follow. Treat each scenario separately by resetting the graph to its original state before examining the effect of each individual scenario. (Note: You will not be graded on any changes you make to the graph.) INTEREST RATE (Percent) Supply Demand LOANABLE FUNDS (Billions of dollars) Demand Supply (?) Scenario 1: Individual Retirement Accounts (IRAS) allow people to shelter some of their income from taxation. Suppose the maximum annual contribution to such accounts is $5,000 per person. Now suppose there is a decrease in the maximum contribution, from $5,000 to $3,000 per year.arrow_forward17. What makes up the supply curve in the loanable funds market? Why does this curve have a positive relationship with the real interest rate?arrow_forward
arrow_back_ios
arrow_forward_ios
Recommended textbooks for you
 Principles of Economics (12th Edition)EconomicsISBN:9780134078779Author:Karl E. Case, Ray C. Fair, Sharon E. OsterPublisher:PEARSON
 Engineering Economy (17th Edition)EconomicsISBN:9780134870069Author:William G. Sullivan, Elin M. Wicks, C. Patrick KoellingPublisher:PEARSON
 Principles of Economics (MindTap Course List)EconomicsISBN:9781305585126Author:N. Gregory MankiwPublisher:Cengage Learning
 Managerial Economics: A Problem Solving ApproachEconomicsISBN:9781337106665Author:Luke M. Froeb, Brian T. McCann, Michael R. Ward, Mike ShorPublisher:Cengage Learning
 Managerial Economics & Business Strategy (Mcgraw-...EconomicsISBN:9781259290619Author:Michael Baye, Jeff PrincePublisher:McGraw-Hill Education
Principles of Economics (12th Edition)
Economics
ISBN:9780134078779
Author:Karl E. Case, Ray C. Fair, Sharon E. Oster
Publisher:PEARSON
Engineering Economy (17th Edition)
Economics
ISBN:9780134870069
Author:William G. Sullivan, Elin M. Wicks, C. Patrick Koelling
Publisher:PEARSON
Principles of Economics (MindTap Course List)
Economics
ISBN:9781305585126
Author:N. Gregory Mankiw
Publisher:Cengage Learning
Managerial Economics: A Problem Solving Approach
Economics
ISBN:9781337106665
Author:Luke M. Froeb, Brian T. McCann, Michael R. Ward, Mike Shor
Publisher:Cengage Learning
Managerial Economics & Business Strategy (Mcgraw-...
Economics
ISBN:9781259290619
Author:Michael Baye, Jeff Prince
Publisher:McGraw-Hill Education