MATLAB: An Introduction with Applications
6th Edition
ISBN: 9781119256830
Author: Amos Gilat
Publisher: John Wiley & Sons Inc
expand_more
expand_more
format_list_bulleted
Topic Video
Question

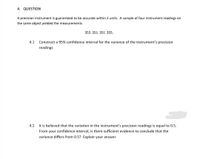
Transcribed Image Text:4. QUESTION
A precision instrument is guaranteed to be accurate within 2 units. A sample of four instrument readings on
the same object yielded the measurements
353 351 351 355.
4.1
Construct a 95% confidence interval for the variance of the instrument's precision
readings
4.2 It is believed that the variation in the instrument's precision readings is equal to 0.5.
From your confidence interval, is there sufficient evidence to conclude that the
variance differs from 0.5? Explain your answer
Expert Solution
arrow_forward
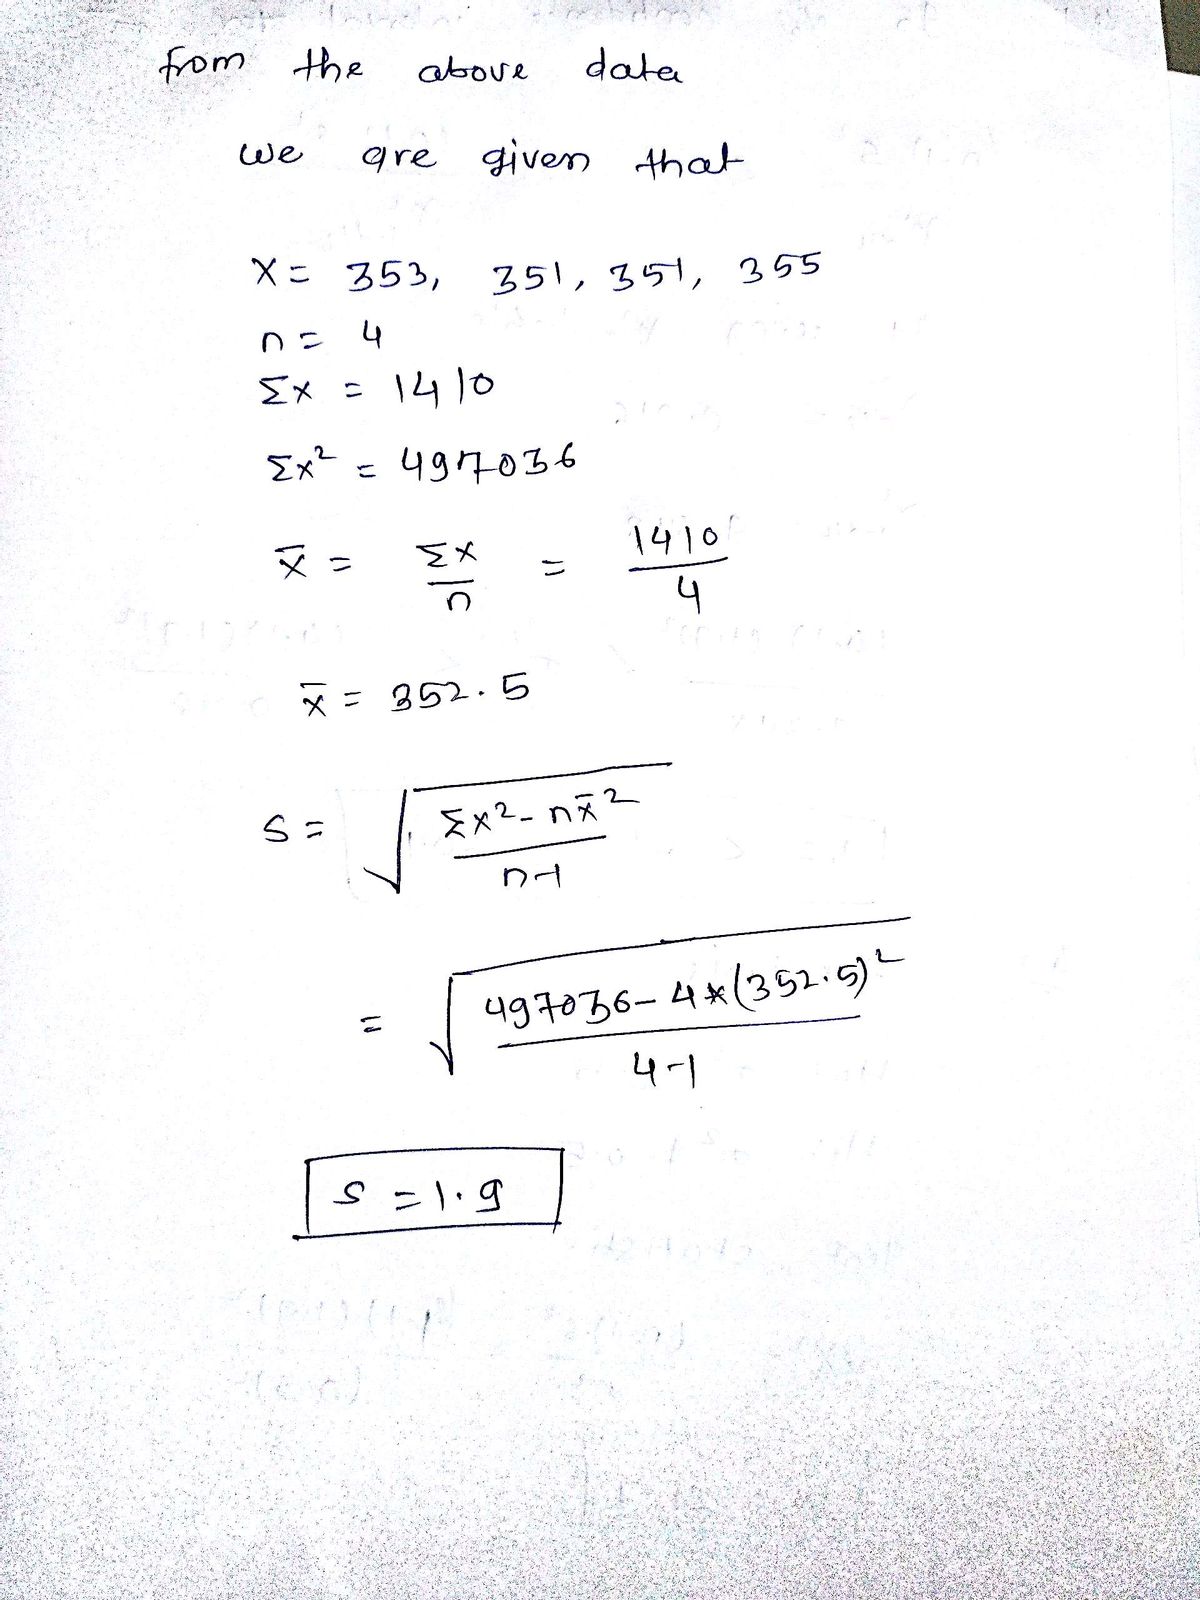
Step 1

Step by stepSolved in 3 steps with 3 images

Knowledge Booster
Learn more about
Need a deep-dive on the concept behind this application? Look no further. Learn more about this topic, statistics and related others by exploring similar questions and additional content below.Similar questions
- Two samples of 6 and 5 items respectively gave the following data : Mean of 1st sample 40 Standard deviation of 1st sample Mean of the second sample 50 Standard deviation of the 2nd sample 10 Is the difference of means significant ? The value of t for 9 degress of freedom at 5% level is 2.26arrow_forwardPart 1 of 3 A researcher was investigating the size of math departments in Texas colleges. She believed the population standard deviation was 1.9. A sample of 42 colleges found their mean was 12.5. Find the 3-decimal small value of the 95% confidence interval of the mean. Part 2 of 3: Find the 3-decimal large value of the 95% confidence interval of the mean. Part 3 of 3: Find the 3-decimal margin of errorarrow_forwardC AND D ONLYarrow_forward
- The mean change in muscle thickness observed after a 4-week training regimen was 4 mm, and the 95% confidence interval (CI) for mean change was (-0.5, 8.5). Which is the best scientific conclusion for the effectiveness of this regimen ?arrow_forwardAspirin is packed in 120 tab bottles with weight normally distributed with mean 600g and standard deviation 6g. Rejected bottles are those whose weight differs from the mean weight by 15g or more. That is, rejected bottles have weight either too small or too large. We want to find out how many bottles will be rejected from a daily production of 5000 bottles. 1,Do we have to calculate one z-score or two z-scores? 2. The negative z-score is 3. The positive z-score is 4.How many bottles, of the 5000, do we anticipate to have to reject?arrow_forwardChoose the appropriate statistical test. When computing, be sure to round each answer as indicated. A dentist wonders if depression affects ratings of tooth pain. In the general population, using a scale of 1-10 with higher values indicating more pain, the average pain rating for patients with toothaches is 6.8. A sample of 30 patients that show high levels of depression have an average pain rating of 7.1 (variance 0.8). What should the dentist determine? 1. Calculate the estimated standard error. (round to 3 decimals). [st.error] 2. What is thet-obtained? (round to 3 decimals). 3. What is the t-cv? (exact value) 4. What is your conclusion? Only type "Reject" or Retain"arrow_forward
- 2. A common claim is that garlic lowers cholesterol levels. In a test of the effectiveness of garlic, 49 subjects were treated with doses of raw garlic, and their cholesterol levels were measured before and after the treatment. The changes in their levels of LDL cholesterol have a mean of 0.4 and a standard deviation of 21. Use the sample n = 49 to construct a 95% confidence interval estimate of the mean net change in LDL cholesterol after the garlic treatment. n=49₁ x=0,4₁ 5=21₁ CL = 95%, df=n-1 df=49-1=48arrow_forwardStep 1 of 3. State the null and alternative hypotheses for the test. Step 2 of 3. Compute the value of the test statistic. Round your answer to three decimal places Step 3 of 3. Draw a conclusion and interpret the decision.arrow_forward7.2.14 Question Help In a test of the effectiveness of garlic for lowering cholesterol, 42 subjects were treated with garlic in a processed tablet form. Cholesterol levels were measured before and after the treatment. The changes (before - after) in their levels of LDL cholesterol (in mg/dL) have a mean of 2.9 and a standard deviation of 16.7. Construct a 95% confidence interval estimate of the mean net change in LDL cholesterol after the garlic treatment. What does the confidence interval suggest about the effectiveness of garlic in reducing LDL cholesterol? Click here to view a t distribution table. Click here to view page 1 of the standard normal distribution table. Click here to view page 2 of the standard normal distribution table. What is the confidence interval estimate of the population mean µ? mg/dL < µarrow_forwardarrow_back_iosarrow_forward_ios
Recommended textbooks for you
 MATLAB: An Introduction with ApplicationsStatisticsISBN:9781119256830Author:Amos GilatPublisher:John Wiley & Sons Inc
 Probability and Statistics for Engineering and th...StatisticsISBN:9781305251809Author:Jay L. DevorePublisher:Cengage Learning
 Statistics for The Behavioral Sciences (MindTap C...StatisticsISBN:9781305504912Author:Frederick J Gravetter, Larry B. WallnauPublisher:Cengage Learning
 Elementary Statistics: Picturing the World (7th E...StatisticsISBN:9780134683416Author:Ron Larson, Betsy FarberPublisher:PEARSON
 The Basic Practice of StatisticsStatisticsISBN:9781319042578Author:David S. Moore, William I. Notz, Michael A. FlignerPublisher:W. H. Freeman
 Introduction to the Practice of StatisticsStatisticsISBN:9781319013387Author:David S. Moore, George P. McCabe, Bruce A. CraigPublisher:W. H. Freeman

MATLAB: An Introduction with Applications
Statistics
ISBN:9781119256830
Author:Amos Gilat
Publisher:John Wiley & Sons Inc

Probability and Statistics for Engineering and th...
Statistics
ISBN:9781305251809
Author:Jay L. Devore
Publisher:Cengage Learning

Statistics for The Behavioral Sciences (MindTap C...
Statistics
ISBN:9781305504912
Author:Frederick J Gravetter, Larry B. Wallnau
Publisher:Cengage Learning

Elementary Statistics: Picturing the World (7th E...
Statistics
ISBN:9780134683416
Author:Ron Larson, Betsy Farber
Publisher:PEARSON

The Basic Practice of Statistics
Statistics
ISBN:9781319042578
Author:David S. Moore, William I. Notz, Michael A. Fligner
Publisher:W. H. Freeman

Introduction to the Practice of Statistics
Statistics
ISBN:9781319013387
Author:David S. Moore, George P. McCabe, Bruce A. Craig
Publisher:W. H. Freeman