
MATLAB: An Introduction with Applications
6th Edition
ISBN: 9781119256830
Author: Amos Gilat
Publisher: John Wiley & Sons Inc
expand_more
expand_more
format_list_bulleted
Related questions
Question
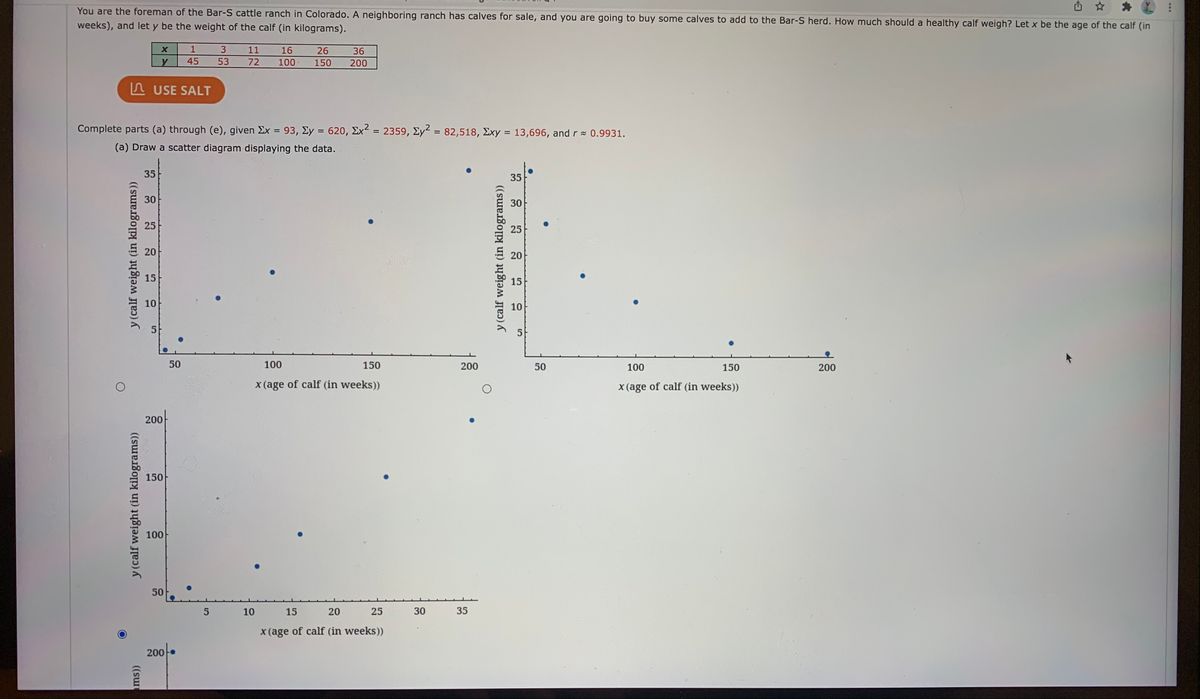

Transcribed Image Text:You are the foreman of the Bar-S cattle ranch in Colorado. A neighboring ranch has calves for sale, and you are going to buy some calves to add to the Bar-S herd. How much should a healthy calf weigh? Let x be the age of the calf (in
weeks), and let y be the weight of the calf (in kilograms).
1
3.
11
16
26
36
45
53
72
100
150
200
n USE SALT
Complete parts (a) through (e), given Ex = 93, Ey = 620, Ex = 2359, Ey = 82,518, Exy = 13,696, and r 0.9931.
%D
(a) Draw a scatter diagram displaying the data.
35
35
25
25
E 20
20
15
15
10
10
5
50
100
150
200
50
100
150
200
x (age of calf (in weeks))
x (age of calf (in weeks))
200
150
100
50
10
15
20
25
30
35
x(age of calf (in weeks))
200
ams))
y (calf weight (in kilograms))
y(calf weight (in kilograms))
30
y (calf weight (in kilograms))
30

Transcribed Image Text:30
150
25
20
15
100
10
50
10
15
20
25
35
50
100
150
200
x (age of calf (in weeks))
x (age of calf (in weeks))
200
35
30
150
25
20
15
100
10
5
50
10
15
20
25
30
35
50
100
150
200
x (age of calf (in weeks))
x (age of calf (in weeks))
(e) Find the value of the coefficient of determination r. What percentage of the variation in y can be explained by the corresponding variation in x and the least-squares line? What percentage is unexplained? (Round your answer
for r to four decimal places. Round your answers for the percentages to two decimal place.)
12 =
%3D
explained
unexplained
(f) The calves you want to buy are 21 weeks old. What does the least-squares line predict for a healthy weight? (Round your answer to two decimal places.)
kg
y (calf weight (in kilograms)
y (calf weight (in kilograms)
5.
30
y (calf weight (in kilograms))
y (calf weight (in kilograms))
Expert Solution
This question has been solved!
Explore an expertly crafted, step-by-step solution for a thorough understanding of key concepts.

This is a popular solution

Trending nowThis is a popular solution!

Step by stepSolved in 2 steps with 2 images

Knowledge Booster

Similar questions
- Show that E(y^2)= standard deviation square y plus residual square capital Yarrow_forwardClinical research attempts to identify the risks of exposure tothe population in the workplace. In a group of 46 menBetween the ages of 25 and 36, changes in the function of their lungs have been measured. One of the variables of interest was the volumeexhalation force (VFE), which is the volume of air exhaled per second. At the end of a certain period, it was found that the VFE of `this sample decreased with an average of 0.27 liters and a deviation0.52 liter sample type. We know that the VFE increases by 0.1liter in healthy men of the same ageduring the same period of time. Can we conclude that the middle ofwork of this group plays a significant role in the growth ofVFE greater than 0.1 liter? Choose the appropriate hypothesis testto do. Give the value - P and your conclusion. Take α = 0.02.arrow_forwardBASED ON THIS DATA, what does the r^2 values tell you? and the linear regression line is the information statistically significant?arrow_forward
- What the the estimated marginal effect at the mean?arrow_forwardKeep getting the last p wrongarrow_forwardGiven the values in the table in the image attached, how do I find the value of r^2? Does the value suggest that the model is a good, somewhat good, or bad fit? About what percent of the total variation in y can be explained by the model? What percent is unexplained?arrow_forward
arrow_back_ios
SEE MORE QUESTIONS
arrow_forward_ios
Recommended textbooks for you
- MATLAB: An Introduction with ApplicationsStatisticsISBN:9781119256830Author:Amos GilatPublisher:John Wiley & Sons Inc
 Probability and Statistics for Engineering and th...StatisticsISBN:9781305251809Author:Jay L. DevorePublisher:Cengage Learning
 Statistics for The Behavioral Sciences (MindTap C...StatisticsISBN:9781305504912Author:Frederick J Gravetter, Larry B. WallnauPublisher:Cengage Learning
  Elementary Statistics: Picturing the World (7th E...StatisticsISBN:9780134683416Author:Ron Larson, Betsy FarberPublisher:PEARSON
 The Basic Practice of StatisticsStatisticsISBN:9781319042578Author:David S. Moore, William I. Notz, Michael A. FlignerPublisher:W. H. Freeman
 Introduction to the Practice of StatisticsStatisticsISBN:9781319013387Author:David S. Moore, George P. McCabe, Bruce A. CraigPublisher:W. H. Freeman
MATLAB: An Introduction with Applications
Statistics
ISBN:9781119256830
Author:Amos Gilat
Publisher:John Wiley & Sons Inc
Probability and Statistics for Engineering and th...
Statistics
ISBN:9781305251809
Author:Jay L. Devore
Publisher:Cengage Learning
Statistics for The Behavioral Sciences (MindTap C...
Statistics
ISBN:9781305504912
Author:Frederick J Gravetter, Larry B. Wallnau
Publisher:Cengage Learning
Elementary Statistics: Picturing the World (7th E...
Statistics
ISBN:9780134683416
Author:Ron Larson, Betsy Farber
Publisher:PEARSON
The Basic Practice of Statistics
Statistics
ISBN:9781319042578
Author:David S. Moore, William I. Notz, Michael A. Fligner
Publisher:W. H. Freeman
Introduction to the Practice of Statistics
Statistics
ISBN:9781319013387
Author:David S. Moore, George P. McCabe, Bruce A. Craig
Publisher:W. H. Freeman