Advanced Engineering Mathematics
10th Edition
ISBN: 9780470458365
Author: Erwin Kreyszig
Publisher: Wiley, John & Sons, Incorporated
expand_more
expand_more
format_list_bulleted
Question

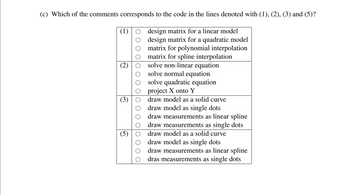
Transcribed Image Text:(c) Which of the comments corresponds to the code in the lines denoted with (1), (2), (3) and (5)?
(1)
design matrix for a linear model
design matrix for a quadratic model
matrix for polynomial interpolation
matrix for spline interpolation
(2)
solve non-linear equation
solve normal equation
solve quadratic equation
project X onto Y
(3)
draw model as a solid curve
draw model as single dots
(5)
оо
draw measurements as linear spline
draw measurements as single dots
draw model as a solid curve
draw model as single dots
draw measurements as linear spline
dras measurements as single dots
![% read in data
data =
xm
ут
csvread('measurements.csv');
data(:,1); % 50 measurements for x
data (:,2); % 50 measurements for y
M = [ones (size (xm)), xm, xm.^2]; %
b =
(MM) (-1) *M'*y; %
(1)
(2)
& display results.
figure (1), clf, hold on prepare figure
plot (xm, ym, ' . ');
응
(3)
linspace (min (xm), max (xm),200); % define values for x
& determine predicted model values
y =
plot (x, y,'-') &
(4)
(5)
Please answer the following multiple choice questions in part a.), b.) and c.):
(a) Which numerical method has been used in the above given example?
polynomial interpolation
numerical differentiation
least-squares regression
numerical integration
(b) Choose the correct code that needs to be put into the line denoted with the number (4):
(4) O
О
y
y
=
1+b(2) + b(3) ;
1 + x + x.^2 ;
y
=
b (1)
= b (1)
y
=
b (2) *x + b (3) *x. ^2 ;
+ b (2) *x ;](https://content.bartleby.com/qna-images/question/4810b3f8-7174-4e11-ad5b-d1003066dd42/51327c89-77ec-4281-8893-99753daad6cd/0l7wmt4_thumbnail.png)
Transcribed Image Text:% read in data
data =
xm
ут
csvread('measurements.csv');
data(:,1); % 50 measurements for x
data (:,2); % 50 measurements for y
M = [ones (size (xm)), xm, xm.^2]; %
b =
(MM) (-1) *M'*y; %
(1)
(2)
& display results.
figure (1), clf, hold on prepare figure
plot (xm, ym, ' . ');
응
(3)
linspace (min (xm), max (xm),200); % define values for x
& determine predicted model values
y =
plot (x, y,'-') &
(4)
(5)
Please answer the following multiple choice questions in part a.), b.) and c.):
(a) Which numerical method has been used in the above given example?
polynomial interpolation
numerical differentiation
least-squares regression
numerical integration
(b) Choose the correct code that needs to be put into the line denoted with the number (4):
(4) O
О
y
y
=
1+b(2) + b(3) ;
1 + x + x.^2 ;
y
=
b (1)
= b (1)
y
=
b (2) *x + b (3) *x. ^2 ;
+ b (2) *x ;
Expert Solution
This question has been solved!
Explore an expertly crafted, step-by-step solution for a thorough understanding of key concepts.
Step by stepSolved in 2 steps

Knowledge Booster
Similar questions
- If (3A) = (³ 3 3 -12 ' then the a2,1 entry of the matrix A isarrow_forwardBy using the method of least squares, find the best parabola through the points: (-1,-3). (1,3). (-2,-3). (0,-3) Step 1. The general equation of a parabola is c₂+₁+c₂2²-3. Plugging the data points into this formula gives a matrix equation Ac=y. 1 ATA- ATy= 1 Step 3. Solving the normal equation gives the answer -8 which corresponds to the formula a Step 2. The matrix equation Ac=y has no solution, so instead we use the normal equation A¹A = A¹y O 0 3arrow_forwardWrite down the 4 by 4 matrix S that scales by a constant c. Multiply ST and also TS, where T is translation by (1, 4, 3). To blow up the picture around the center point (1, 4, 3), would you use vST or vT S?arrow_forward
- Log in State State y! uk.se M Inbox A Login YouTube Maps 3X3 Matrices. General Top Events Event Brief Sign In activatelearningonline.instructure.com/courses/24467/pages/assignment-8-bc-deadline-21-slash-06-slash-23?module_item_id=813826 A 2x + 3y = 18 D 4x - y = 8 As X 0 Mark 3. Solve your given pair of simultaneous equations (with two variables) using matrix and determinant methods. E 3a+b-2c=-9 E B x-2y = -5 E 6x-3y = 6) R 4. Solve your given set of simultaneous equations (with three variables) using matrix and determinant methods. A 2a-2b+2c=2 C 3a-b+ 2c = 3 (0) duve 5. Solve your given pair of complex numbers placing them O Search IL Searc Y € 3x19 13 F 5x - 4y = −1 B-a-b+c=3 D = a + b +2c=11 F 2a + 3b + c = 8 * New 00 8 LAA O A Pillov O Solve Parrow_forwardSOLVE THE SYSTEM USING THE MATRIX じメPOMENテAL LUSG JORDA EXPONENTIAL FORM) x(6)= 12 L7arrow_forward
arrow_back_ios
arrow_forward_ios
Recommended textbooks for you
 Advanced Engineering MathematicsAdvanced MathISBN:9780470458365Author:Erwin KreyszigPublisher:Wiley, John & Sons, Incorporated
 Numerical Methods for EngineersAdvanced MathISBN:9780073397924Author:Steven C. Chapra Dr., Raymond P. CanalePublisher:McGraw-Hill Education
 Introductory Mathematics for Engineering Applicat...Advanced MathISBN:9781118141809Author:Nathan KlingbeilPublisher:WILEY
 Mathematics For Machine TechnologyAdvanced MathISBN:9781337798310Author:Peterson, John.Publisher:Cengage Learning,


Advanced Engineering Mathematics
Advanced Math
ISBN:9780470458365
Author:Erwin Kreyszig
Publisher:Wiley, John & Sons, Incorporated

Numerical Methods for Engineers
Advanced Math
ISBN:9780073397924
Author:Steven C. Chapra Dr., Raymond P. Canale
Publisher:McGraw-Hill Education

Introductory Mathematics for Engineering Applicat...
Advanced Math
ISBN:9781118141809
Author:Nathan Klingbeil
Publisher:WILEY

Mathematics For Machine Technology
Advanced Math
ISBN:9781337798310
Author:Peterson, John.
Publisher:Cengage Learning,

