
MATLAB: An Introduction with Applications
6th Edition
ISBN: 9781119256830
Author: Amos Gilat
Publisher: John Wiley & Sons Inc
expand_more
expand_more
format_list_bulleted
Related questions
Concept explainers
Topic Video
Question
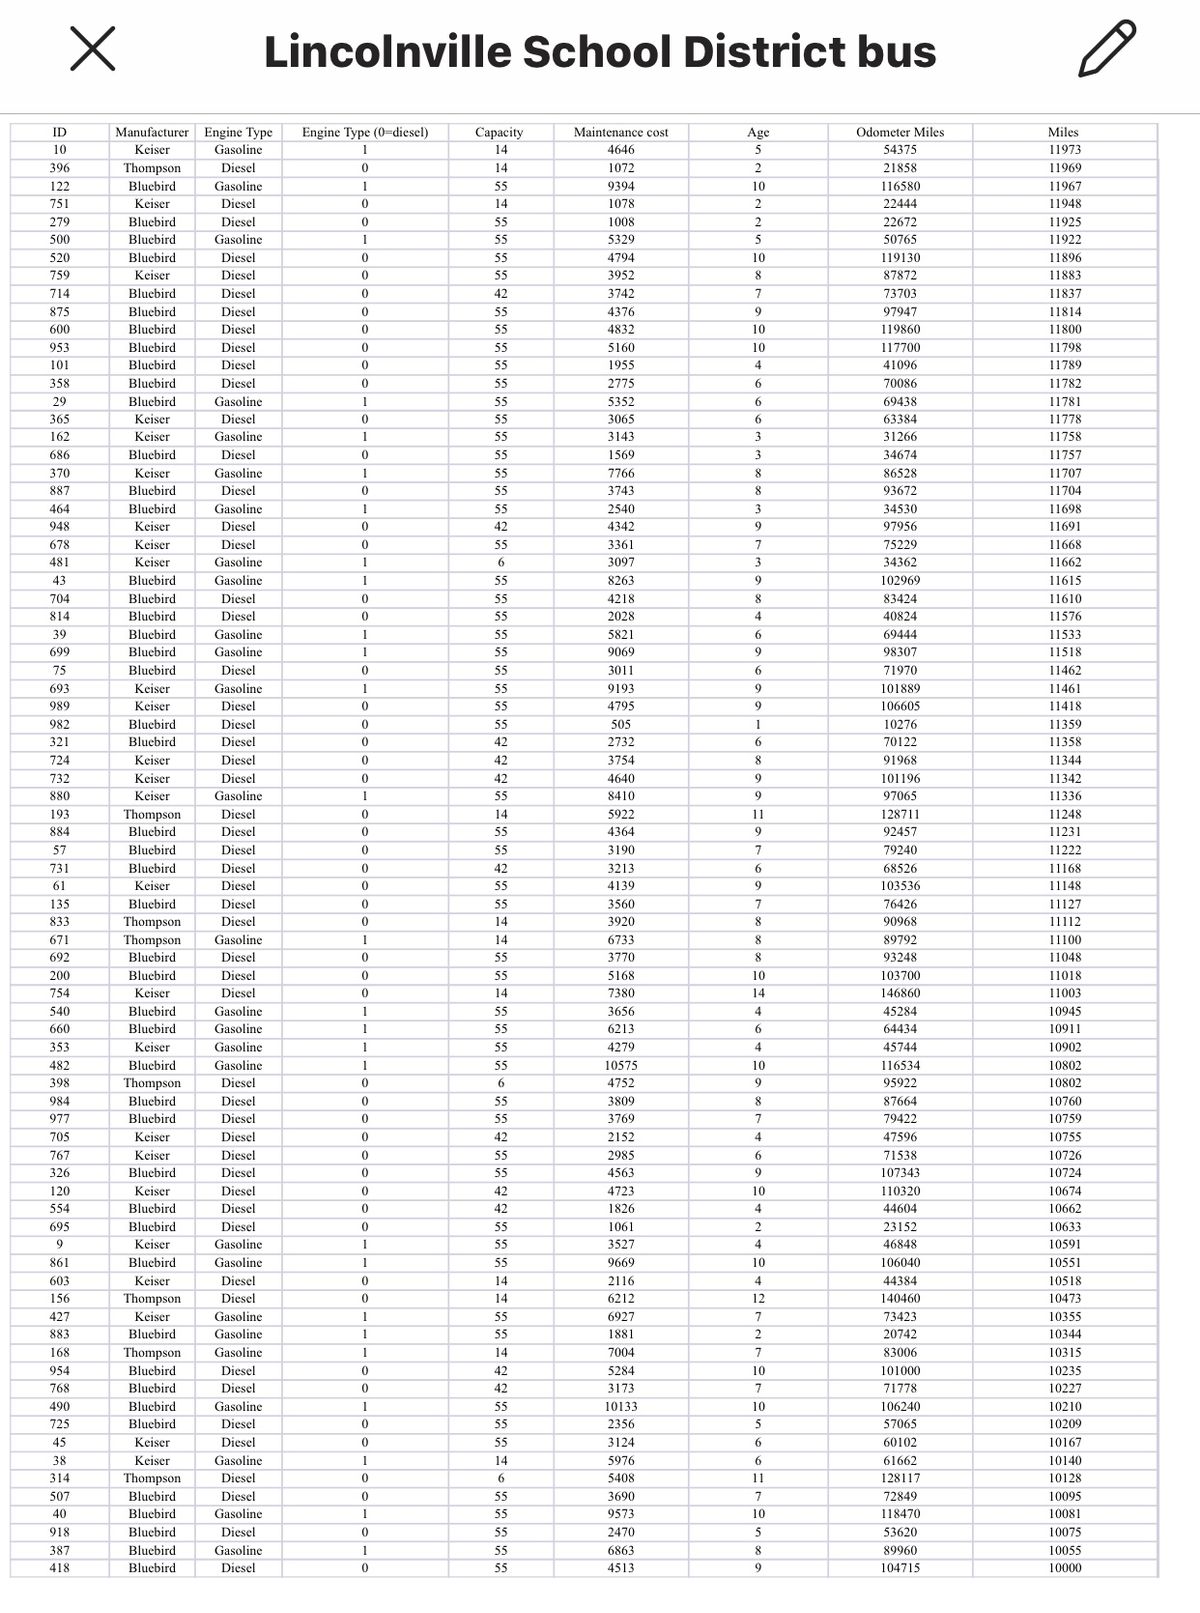

Transcribed Image Text:Lincolnville School District bus
ID
Manufacturer Engine Type
Engine Type (0-diesel)
Сараcity
Maintenance cost
Age
Odometer Miles
Miles
10
Keiser
Gasoline
14
4646
5
54375
11973
396
Thompson
Diesel
14
1072
2
21858
11969
122
Bluebird
Gasoline
1
55
9394
10
116580
11967
751
Keiser
Diesel
14
1078
2.
22444
11948
279
Bluebird
Diesel
55
1008
22672
11925
500
Bluebird
Gasoline
1
55
5329
50765
11922
520
Bluebird
Diesel
55
4794
10
119130
11896
759
Keiser
Diesel
55
3952
8
87872
11883
714
Bluebird
Diesel
42
3742
7.
73703
11837
875
Bluebird
Diesel
55
4376
9
97947
11814
600
Bluebird
Diesel
55
4832
10
119860
11800
953
Bluebird
Diesel
55
5160
10
117700
11798
101
Bluebird
Diesel
55
1955
4
41096
11789
358
Bluebird
Diesel
55
2775
6
70086
11782
29
Bluebird
Gasoline
1
55
5352
6
69438
11781
365
Keiser
Diesel
55
3065
6
63384
11778
162
Keiser
Gasoline
1
55
3143
3
31266
11758
686
Bluebird
Diesel
55
1569
3
34674
11757
370
Keiser
Gasoline
1
55
7766
8.
86528
11707
887
Bluebird
Diesel
55
3743
8.
93672
11704
464
Bluebird
Gasoline
1
55
2540
34530
11698
948
Keiser
Diesel
42
4342
9
97956
11691
678
Keiser
Diesel
55
3361
7
75229
11668
481
Keiser
Gasoline
1
3097
3
34362
11662
43
Bluebird
Gasoline
1
55
8263
9
102969
11615
704
Bluebird
Diesel
55
4218
8
83424
11610
814
Bluebird
Diesel
55
2028
4
40824
11576
39
Bluebird
Gasoline
1
55
5821
6
69444
11533
699
Bluebird
Gasoline
1
55
9069
9
98307
11518
75
Bluebird
Diesel
55
3011
6
71970
11462
693
Keiser
Gasoline
1
55
9193
9
101889
11461
989
Keiser
Diesel
55
4795
9
106605
11418
982
Bluebird
Diesel
55
505
1
10276
11359
321
Bluebird
Diesel
42
2732
6.
70122
11358
724
Keiser
Diesel
42
3754
8.
91968
11344
732
Keiser
Diesel
42
4640
9
101196
11342
880
Keiser
Gasoline
1
55
8410
9
97065
11336
193
Thompson
Diesel
14
5922
11
128711
11248
884
Bluebird
Diesel
55
4364
9
92457
11231
57
Bluebird
Diesel
55
3190
7
79240
11222
731
Bluebird
Diesel
42
3213
6
68526
11168
61
Keiser
Diesel
55
4139
9
103536
11148
135
Bluebird
Diesel
55
3560
7.
76426
11127
833
Thompson
Diesel
14
3920
8
90968
11112
671
Thompson
Gasoline
1
14
6733
8
89792
11100
692
Bluebird
Diesel
55
3770
8
93248
11048
200
Bluebird
Diesel
55
5168
10
103700
11018
754
Keiser
Diesel
14
7380
14
146860
11003
540
Bluebird
Gasoline
1
55
3656
4
45284
10945
660
Bluebird
Gasoline
1
55
6213
64434
10911
353
Keiser
Gasoline
1
55
4279
4
45744
10902
482
Bluebird
Gasoline
1
55
10575
10
116534
10802
Thompson
Bluebird
398
Diesel
6
4752
95922
10802
984
Diesel
55
3809
8
87664
10760
977
Bluebird
Diesel
55
3769
7.
79422
10759
705
Keiser
Diesel
42
2152
47596
10755
767
Keiser
Diesel
55
2985
6
71538
10726
326
Bluebird
Diesel
55
4563
9
107343
10724
120
Keiser
Diesel
42
4723
10
110320
10674
554
Bluebird
Diesel
42
1826
4
44604
10662
695
Blucbird
Diesel
55
1061
23152
10633
9
Keiser
Gasoline
1
55
3527
4
46848
10591
861
Bluebird
Gasoline
1
55
9669
10
106040
10551
603
Keiser
Diesel
14
2116
4
44384
10518
156
Thompson
Diesel
14
6212
12
140460
10473
427
Keiser
Gasoline
1
55
6927
7
73423
10355
883
Bluebird
Gasoline
1
55
1881
20742
10344
168
Thompson
Gasoline
1
14
7004
83006
10315
954
Bluebird
Diesel
42
5284
10
101000
10235
768
Bluebird
Diesel
42
3173
7
71778
10227
490
Bluebird
Gasoline
1
55
10133
10
106240
10210
725
Blucbird
Diesel
55
2356
5
57065
10209
45
Keiser
Diesel
55
3124
60102
10167
38
Keiser
Gasoline
1
14
5976
6
61662
10140
314
Thompson
Diesel
6
5408
11
128117
10128
507
Bluebird
Diesel
55
3690
7
72849
10095
40
Bluebird
Gasoline
1
55
9573
10
118470
10081
918
Bluebird
Diesel
55
2470
5
53620
10075
387
Bluebird
Gasoline
1
55
6863
8.
89960
10055
418
Bluebird
Diesel
55
4513
9
104715
10000

Transcribed Image Text:3. Refer to the Lincolnville School District bus data.
a. Select the variable for the number of miles traveled
last month. Conduct a hypothesis test to determine
whether the mean miles traveled last month equals
10,000. Use the .01 significance level. Find the p-
value and explain what it means.
b. A study of school bus fleets reports that the average
per bus maintenance cost is $4,000 per year. Using
the maintenance cost variable, conduct a hypothesis
test to determine whether the mean maintenance
cost for Lincolnville's bus fleet is more than $4,000
at the .05 significance level. Determine the p-value
and report the results.
Expert Solution
This question has been solved!
Explore an expertly crafted, step-by-step solution for a thorough understanding of key concepts.

This is a popular solution

Trending nowThis is a popular solution!

Step by stepSolved in 2 steps

Knowledge Booster


Learn more about
Need a deep-dive on the concept behind this application? Look no further. Learn more about this topic, statistics and related others by exploring similar questions and additional content below.Similar questions
- 4 Ms. Lisa Monnin is the budget director for Nexus Media Inc. She would like to compare the daily travel expenses for the sales staff and the audit staff. She collected the following sample information. Sales ($) Audit ($) 125 137 147 162 136 142 128 107 130 141 141 108 140 At the 0.01 significance level, can she conclude that the mean daily expenses are greater for the sales staff than the audit staff? Click here for the Excel Data File 1. State the decision rule. (Round your answer to 3 decimal places.) Reject Ho if t> 2. Compute the pooled estimate of the population variance. (Round your answer to 2 decimal places.) Pooled variance 3. Compute the test statistic. (Round your answer to 3 decimal places.) Value of the test statistic 4. State your decision about the null hypothesis. (Click to select) Ho: H₂ Ha 5. Estimate the p-value. (Round your answers to 3 decimal places.) p-value (Click to select) Sales 125 137 147 162 136 142 Audit 128 107 130 141 141 108 140arrow_forwardSuppose the mean price for used cars is $10,198. A manager of a Kansas City used car dealership reviewed a sample of 50 recent used car sales at the dealership in an attempt to determine whether the population mean price for used cars at this particular dealership differed from the national mean. The prices for the sample of 50 cars are shown in the file named UsedCars. 12,400 10,400 12,100 10,000 11,000 8,895 7,675 9,975 6,350 10,470 9,895 11,250 8,795 12,500 9,340 10,150 9,200 9,395 11,000 10,640 10,000 7,500 8,000 10,440 10,200 10,300 9,740 9,280 10,930 8,000 9,000 7,680 9,400 10,730 7,350 12,240 11,970 8,240 9,910 10,080 9,440 8,970 9,500 10,050 10,130 11,400 8,500 7,500 9,090 10,500 (a) Formulate the hypotheses that can be used to determine whether a difference exists in the mean price for used cars at the dealership. H0: ? ≤ 10,198 Ha: ? > 10,198 H0: ? < 10,198 Ha: ? ≥ 10,198 H0: ? = 10,198 Ha: ? ≠ 10,198 H0: ? > 10,198 Ha: ? ≤ 10,198 H0: ? ≥ 10,198…arrow_forwardThe average house has 15 paintings on its walls. Is the mean larger for houses owned by teachers? The data show the results of a survey of 16 teachers who were asked how many paintings they have in their houses. Assume that the distribution of the population is normal. 18, 15, 17, 14, 16, 17, 18, 15, 15, 14, 14, 14, 15, 15, 16, 18 What can be concluded at the a = 0.05 level of significance? a. For this study, we should use Select an answer b. The null and alternative hypotheses would be: Но: Select an answer v H1: Select an answer v c. The test statistic ? v = (please show your answer to 3 decimal places.) d. The p-value = (Please show your answer to 4 decimal places.) e. The p-value is ? va f. Based on this, we should Select an answer v the null hypothesis. g. Thus, the final conclusion is that ... O The data suggest the population mean is not significantly more than 15 at a = 0.05, so there is sufficient evidence to conclude that the population mean number of paintings that are in…arrow_forward
- could you please answer with paper and pen?arrow_forwardThe cities with the highest life expectancy are Nowhereville: 84.6 years; Somewhereopolis: 79.8 years; Kinch City: 79.8 years; Tortuga: 84.6 years; Euler Town: 78.5 years; Godelville: 84.6 years; Sirap: 90.1 years. Find the mean, the median, and the mode. ..... Find the mean. Select the correct choice below and, if necessary, fill in the answer box to complete your choice. A. The mean life expectancy is years. (Round to the nearest tenth as needed.) B. The mean does not exist. Find the median. Select the correct choice below and, if necessary, fill in the answer box to complete your choice. O A. The median life expectancy is years. (Round to the nearest tenth as needed.) B. The median does not exist. Find the mode. Select the correct choice below and, if necessary, fill in the answer box to complete your choice. O A. The mode life expectancy is years. (Round to the nearest tenth as needed.) O B. The mode does not exist.arrow_forwardDetermine whether the underlined number is a statistic or a parameter. in a study of all 4622 professors at a college, it is found that 40% own a television.arrow_forward
- To decide between using an independent-samples t test and a paired-samples t test, what question should the researcher ask? a. Is the goal to measure association or to make a prediction? b. Are there more than two levels of the independent variable? c. Is the population mean known? d. Is the research design between-groups or within-groupsarrow_forwardAn insurance company crashed four cars of the same model at 5 miles per hour. The costs of repair for each of the four crashes were $444, $447, $470, and $207 O. Compute the mean, median, and mode cost of repair. Compute the mean cost of repair. Select the correct choice below and, if necessary, fill in the answer box to complete your choice. O A. The mean cost of repair is $ (Round to the nearest cent as needed.) O B. The mean does not exist. Compute the median cost of repair. Select the correct choice below and, if necessary, fill in the answer box to complete your choice. O A. The median cost of repair is $ (Round to the nearest cent as needed.) O B. The median does not exist. Compute the mode cost of repair. Select the correct choice below and, if necessary, fill in the answer box to complete your choice. O A. The mode cost of repair is $ (Round to the nearest cent as needed.) O B. The mode does not exist.arrow_forwardO A. There is sufficient evidence to support the claim that the mean attendance is greater than 523. O B. There is not sufficient evidence to support the claim that the mean attendance is less than 523. O C. There is sufficient evidence to support the claim that the mean attendance is less than 523. O D. There is not sufficient evidence to support the claim that the mean attendance is greater than 523arrow_forward
arrow_back_ios
arrow_forward_ios
Recommended textbooks for you
- MATLAB: An Introduction with ApplicationsStatisticsISBN:9781119256830Author:Amos GilatPublisher:John Wiley & Sons Inc
 Probability and Statistics for Engineering and th...StatisticsISBN:9781305251809Author:Jay L. DevorePublisher:Cengage Learning
 Statistics for The Behavioral Sciences (MindTap C...StatisticsISBN:9781305504912Author:Frederick J Gravetter, Larry B. WallnauPublisher:Cengage Learning
  Elementary Statistics: Picturing the World (7th E...StatisticsISBN:9780134683416Author:Ron Larson, Betsy FarberPublisher:PEARSON
 The Basic Practice of StatisticsStatisticsISBN:9781319042578Author:David S. Moore, William I. Notz, Michael A. FlignerPublisher:W. H. Freeman
 Introduction to the Practice of StatisticsStatisticsISBN:9781319013387Author:David S. Moore, George P. McCabe, Bruce A. CraigPublisher:W. H. Freeman
MATLAB: An Introduction with Applications
Statistics
ISBN:9781119256830
Author:Amos Gilat
Publisher:John Wiley & Sons Inc
Probability and Statistics for Engineering and th...
Statistics
ISBN:9781305251809
Author:Jay L. Devore
Publisher:Cengage Learning
Statistics for The Behavioral Sciences (MindTap C...
Statistics
ISBN:9781305504912
Author:Frederick J Gravetter, Larry B. Wallnau
Publisher:Cengage Learning
Elementary Statistics: Picturing the World (7th E...
Statistics
ISBN:9780134683416
Author:Ron Larson, Betsy Farber
Publisher:PEARSON
The Basic Practice of Statistics
Statistics
ISBN:9781319042578
Author:David S. Moore, William I. Notz, Michael A. Fligner
Publisher:W. H. Freeman
Introduction to the Practice of Statistics
Statistics
ISBN:9781319013387
Author:David S. Moore, George P. McCabe, Bruce A. Craig
Publisher:W. H. Freeman