
MATLAB: An Introduction with Applications
6th Edition
ISBN: 9781119256830
Author: Amos Gilat
Publisher: John Wiley & Sons Inc
expand_more
expand_more
format_list_bulleted
Related questions
Question
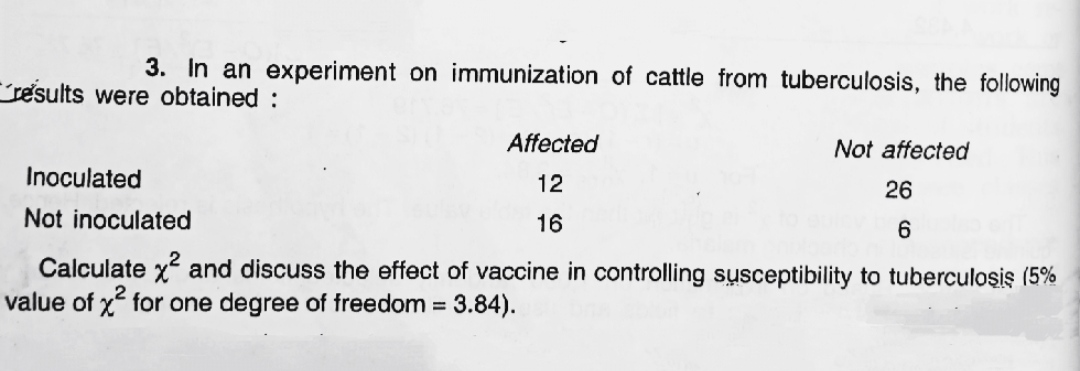

Transcribed Image Text:3. In an experiment on immunization of cattle from tuberculosis, the following
results were obtained :
Affected
Not affected
Inoculated
12
26
Not inoculated
16
6
Calculate x and discuss the effect of vaccine in controlling susceptibility to tuberculosşis (5%
value of x for one degree of freedom = 3.84).
Expert Solution
This question has been solved!
Explore an expertly crafted, step-by-step solution for a thorough understanding of key concepts.

Step by stepSolved in 3 steps with 3 images

Knowledge Booster

Similar questions
- 14arrow_forward.Researchers are testing the breaking strength of a new brand of rope using a large sample of ropes. In a test of Ho: p=0.80 versus Ha: p>0.80, where p is the true proportion of all ropes of this brand that would break when subjected to a weight of 1000 pounds, the test statistic is z = 1.45. Which of the following is true? (A) Ho is rejected at the 5% level, but not at the 10% level of significance. (B) Ho is rejected at the 10% level, but not at the 5% level of significance. (C) Ho is rejected at both the 5% and 10% level of significance. (D) Ho is not rejected at both the 5% and 10% level of significance. (E) Ho is not rejected at any level of significance.arrow_forwardA study of parental empathy for sensitivity cues and baby temperament (higher scores mean more empathy) was performed. Let x1 be a random variable that represents the score of a mother on an empathy test (as regards her baby). Let x2 be the empathy score of a father. A random sample of 30 mothers gave a sample mean of x, = 67.85. Another random sample of 25 fathers gave x2 = 61.72. Assume that o, = 10.85 and oz = 10.57. (a) Let µ̟ be the population mean of x, and let uz be the population mean of x2. Find a 90% confidence interval for H1 - H2. (Use 2 decimal places.) lower limit upper limitarrow_forward
- Two-Fa 23. The following data are from an experiment comparing three different treatment conditions: A 1 N = 15 2 5 ΣΧΧ-354 1 6. 9. 8 8 T = 10 T = 20 T = 30 SS = 14 SS = 30 SS = 30 %3D a. If the experiment uses an independent-measures design, can the researcher conclude that the treatments are significantly different? Test at the .05 level of significance. b. If the experiment is done with a repeated-measures design, should the researcher conclude that the treatments are significantly different? Set alpha at .05 again. c. Explain why the analyses in parts a and b lead to different conclusions. 24. The following data are from a repeated-measures study comparing two treatment conditions.arrow_forward14% of all Americans suffer from sleep apnea. A researcher suspects that a lower percentage of those who live in the inner city have sleep apnea. Of the 359 people from the inner city surveyed, 43 of them suffered from sleep apnea. What can be concluded at the level of significance of αα = 0.05? For this study, we should use Select an answer z-test for a population proportion t-test for a population mean The null and alternative hypotheses would be: Ho: ? μ p Select an answer = ≠ > < (please enter a decimal) H1: ? p μ Select an answer < > = ≠ (Please enter a decimal) The test statistic ? t z = (please show your answer to 3 decimal places.) The p-value = (Please show your answer to 4 decimal places.) The p-value is ? > ≤ αα Based on this, we should Select an answer reject fail to reject accept the null hypothesis. Thus, the final conclusion is that ... The data suggest the populaton proportion is significantly smaller than 14% at αα = 0.05, so…arrow_forward
arrow_back_ios
arrow_forward_ios
Recommended textbooks for you
- MATLAB: An Introduction with ApplicationsStatisticsISBN:9781119256830Author:Amos GilatPublisher:John Wiley & Sons Inc
 Probability and Statistics for Engineering and th...StatisticsISBN:9781305251809Author:Jay L. DevorePublisher:Cengage Learning
 Statistics for The Behavioral Sciences (MindTap C...StatisticsISBN:9781305504912Author:Frederick J Gravetter, Larry B. WallnauPublisher:Cengage Learning
  Elementary Statistics: Picturing the World (7th E...StatisticsISBN:9780134683416Author:Ron Larson, Betsy FarberPublisher:PEARSON
 The Basic Practice of StatisticsStatisticsISBN:9781319042578Author:David S. Moore, William I. Notz, Michael A. FlignerPublisher:W. H. Freeman
 Introduction to the Practice of StatisticsStatisticsISBN:9781319013387Author:David S. Moore, George P. McCabe, Bruce A. CraigPublisher:W. H. Freeman
MATLAB: An Introduction with Applications
Statistics
ISBN:9781119256830
Author:Amos Gilat
Publisher:John Wiley & Sons Inc
Probability and Statistics for Engineering and th...
Statistics
ISBN:9781305251809
Author:Jay L. Devore
Publisher:Cengage Learning
Statistics for The Behavioral Sciences (MindTap C...
Statistics
ISBN:9781305504912
Author:Frederick J Gravetter, Larry B. Wallnau
Publisher:Cengage Learning
Elementary Statistics: Picturing the World (7th E...
Statistics
ISBN:9780134683416
Author:Ron Larson, Betsy Farber
Publisher:PEARSON
The Basic Practice of Statistics
Statistics
ISBN:9781319042578
Author:David S. Moore, William I. Notz, Michael A. Fligner
Publisher:W. H. Freeman
Introduction to the Practice of Statistics
Statistics
ISBN:9781319013387
Author:David S. Moore, George P. McCabe, Bruce A. Craig
Publisher:W. H. Freeman