MATLAB: An Introduction with Applications
6th Edition
ISBN: 9781119256830
Author: Amos Gilat
Publisher: John Wiley & Sons Inc
expand_more
expand_more
format_list_bulleted
Concept explainers
Question
Look at the picture

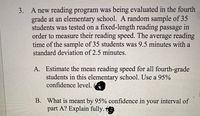
Transcribed Image Text:3. A new reading program was being evaluated in the fourth
grade at an elementary school. A random sample of 35
students was tested on a fixed-length reading passage in
order to measure their reading speed. The average reading
time of the sample of 35 students was 9.5 minutes with a
standard deviation of 2.5 minutes.
A. Estimate the mean reading speed for all fourth-grade
students in this elementary school. Use a 95%
confidence level.
B. What is meant by 95% confidence in your interval of
part A? Explain fully.
Expert Solution
This question has been solved!
Explore an expertly crafted, step-by-step solution for a thorough understanding of key concepts.
This is a popular solution
Trending nowThis is a popular solution!
Step by stepSolved in 2 steps

Knowledge Booster
Learn more about
Need a deep-dive on the concept behind this application? Look no further. Learn more about this topic, statistics and related others by exploring similar questions and additional content below.Similar questions
- the box plot represents the average temperature in seattle for each day in august. what is the interquartile range of the dataarrow_forwardMake a scatter plot of the data and determine which type of model best fits the data. (-3,-1), (-2,0), (-1,1), (0,2), (1,3), (2,4)arrow_forwardSCUBA divers have maximum dive times they cannot exceed when going to different depths. The data in the table below show different depths with the maximum dive times in minutes. (Comma separated lists of the data are also provided below the table to ease in copying the data to R.) Depth in Feet (x) 50 60 70 80 90 100 x: 50, 60, 70, 80, 90, 100 y: 179, 166, 150, 138, 124, 110 Maximum Dive Time in Minutes (y) 179 166 150 138 124 110 1. Find the best fit line for the data. y = + x 2. Graph the scatter plot of the data together with the best fit line using R. (This portion of the problem is not graded.) 3. Predict the maximum dive time at a depth of 23 feet. Question Help: D Post to forumarrow_forward
- How much should a healthy Shetland pony weigh? Let x be the age of the pony (in months), and let y be the average weight of the pony (in kilograms). x 3 6 12 20 26 y 60 95 140 160 189 (a) Make a scatter diagram of the data and visualize the line you think best fits the data. Flash Player version 10 or higher is required for this question. You can get Flash Player free from Adobe's website. (b) Would you say the correlation is low, moderate, or strong? low moderate strong Would you say the correlation is positive or negative? positive negative (c) Use a calculator to verify that x = 67, x2 = 1265, y = 644, y2 = 93,546, and xy = 10,544. Compute r. (Round your answer to three decimal places.) As x increases from 3 to 26 months, does the value of r imply that y should tend to increase or decrease? Explain your answer. Given our value of r, y should…arrow_forwardplease help me answer this for my data analysis classarrow_forwardHow to solve this questionarrow_forward
arrow_back_ios
arrow_forward_ios
Recommended textbooks for you
 MATLAB: An Introduction with ApplicationsStatisticsISBN:9781119256830Author:Amos GilatPublisher:John Wiley & Sons Inc
 Probability and Statistics for Engineering and th...StatisticsISBN:9781305251809Author:Jay L. DevorePublisher:Cengage Learning
 Statistics for The Behavioral Sciences (MindTap C...StatisticsISBN:9781305504912Author:Frederick J Gravetter, Larry B. WallnauPublisher:Cengage Learning
 Elementary Statistics: Picturing the World (7th E...StatisticsISBN:9780134683416Author:Ron Larson, Betsy FarberPublisher:PEARSON
 The Basic Practice of StatisticsStatisticsISBN:9781319042578Author:David S. Moore, William I. Notz, Michael A. FlignerPublisher:W. H. Freeman
 Introduction to the Practice of StatisticsStatisticsISBN:9781319013387Author:David S. Moore, George P. McCabe, Bruce A. CraigPublisher:W. H. Freeman

MATLAB: An Introduction with Applications
Statistics
ISBN:9781119256830
Author:Amos Gilat
Publisher:John Wiley & Sons Inc

Probability and Statistics for Engineering and th...
Statistics
ISBN:9781305251809
Author:Jay L. Devore
Publisher:Cengage Learning

Statistics for The Behavioral Sciences (MindTap C...
Statistics
ISBN:9781305504912
Author:Frederick J Gravetter, Larry B. Wallnau
Publisher:Cengage Learning

Elementary Statistics: Picturing the World (7th E...
Statistics
ISBN:9780134683416
Author:Ron Larson, Betsy Farber
Publisher:PEARSON

The Basic Practice of Statistics
Statistics
ISBN:9781319042578
Author:David S. Moore, William I. Notz, Michael A. Fligner
Publisher:W. H. Freeman

Introduction to the Practice of Statistics
Statistics
ISBN:9781319013387
Author:David S. Moore, George P. McCabe, Bruce A. Craig
Publisher:W. H. Freeman