
MATLAB: An Introduction with Applications
6th Edition
ISBN: 9781119256830
Author: Amos Gilat
Publisher: John Wiley & Sons Inc
expand_more
expand_more
format_list_bulleted
Related questions
Concept explainers
Topic Video
Question

Transcribed Image Text:Class
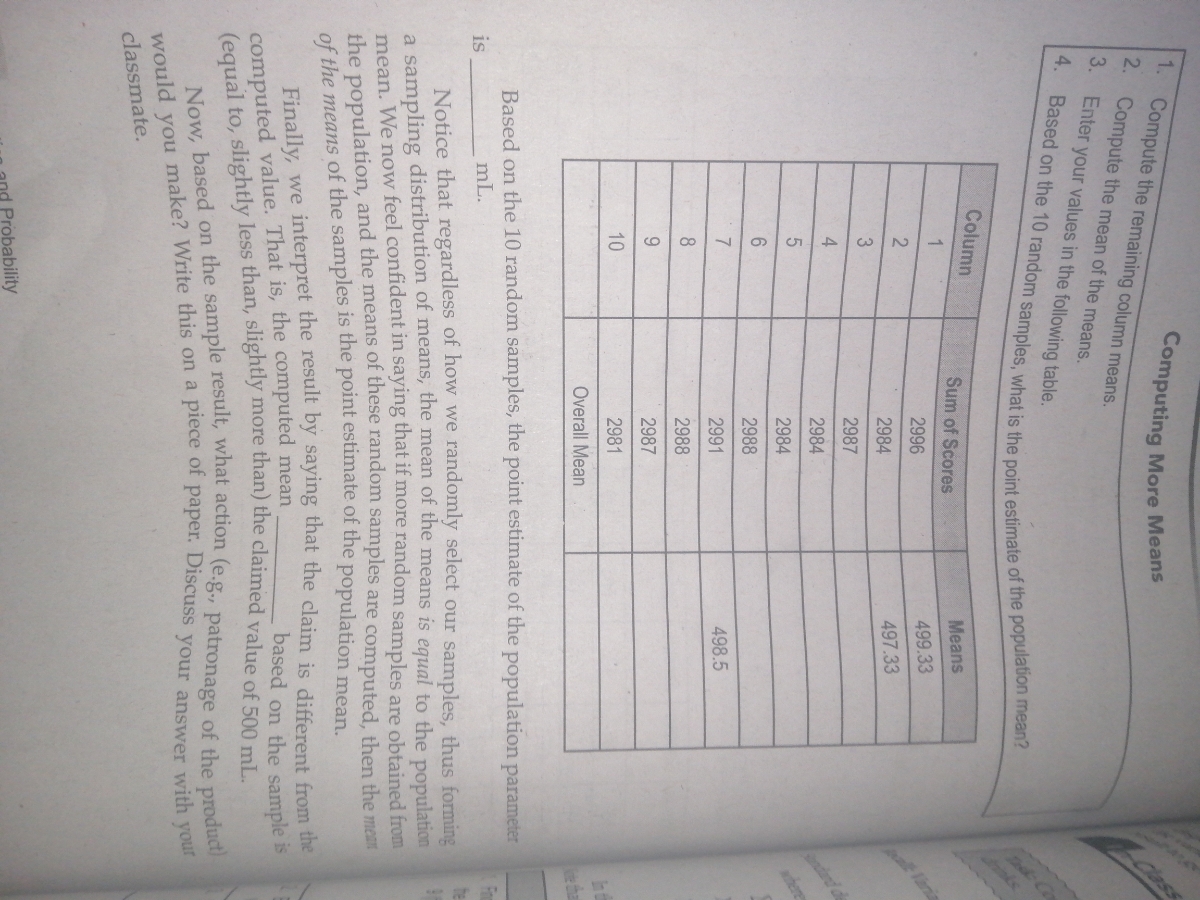
1. Compute the remaining column means.
Computing More Means
2. Compute the mean of the means.
3. Enter your values in the following table.
Column
inks
Sum of Scores
Means
2996
499.33
2
2984
l Vania
497.33
3
2987
4
2984
2984
ahere
2988
2991
498.5
8
2988
9.
2987
10
2981
Overall Mean
Based on the 10 random samples, the point estimate of the population parameter
is
mL.
Notice that regardless of how we randomly select our samples, thus forming
a sampling distribution of means, the mean of the means is equal to the population
mean, We now feel confident in saying that if more random samples are obtained from
the population, and the means of these random samples are computed, then the mean
Einally, we interpret the result by saying that the claim is different from the
computed value. That is, the computed mean
based on the sample is
would
classmate.
Probability
you make? this on a piece of your your
(equal to, less than, slightly more the of mL.
Expert Solution
This question has been solved!
Explore an expertly crafted, step-by-step solution for a thorough understanding of key concepts.

This is a popular solution

Trending nowThis is a popular solution!

Step by stepSolved in 2 steps

Knowledge Booster


Learn more about
Need a deep-dive on the concept behind this application? Look no further. Learn more about this topic, statistics and related others by exploring similar questions and additional content below.Similar questions
- The "Freshman 15" refers to the belief that college students gain 15 lb (or 6.8 kg) during their freshman year. Listed in the accompanying table are weights (kg) of randomly selected male college freshmen. The weights were measured in September and later in April. Use the listed paired sample data, and assume that the samples are simple random samples and that the differences have a distribution that is approximately normal. Complete parts (a) through (c). September 68 71 57 81 68 56 65 64 71 April 64 69 58 82 69 58 68 68 77 a. Use a 0.05 significance level to test the claim that for the population of freshman male college students, the weights in September are less than the weights in the following April. In this example, Hd is the mean value of the differences d for the population of all pairs of data, where each individual difference d is defined as the April weight minus the September weight. What are the null and alternative hypotheses for the hypothesis test? Ho Hd = 0 kg 0 kg H₁…arrow_forward2, 3, 6, 8, 9 1. find the range 2. Use the defining formula to compute the sample standard deviation s. (Round your answer to two decimal places.) 3.arrow_forwardPavanarrow_forward
arrow_back_ios
arrow_forward_ios
Recommended textbooks for you
- MATLAB: An Introduction with ApplicationsStatisticsISBN:9781119256830Author:Amos GilatPublisher:John Wiley & Sons Inc
 Probability and Statistics for Engineering and th...StatisticsISBN:9781305251809Author:Jay L. DevorePublisher:Cengage Learning
 Statistics for The Behavioral Sciences (MindTap C...StatisticsISBN:9781305504912Author:Frederick J Gravetter, Larry B. WallnauPublisher:Cengage Learning
  Elementary Statistics: Picturing the World (7th E...StatisticsISBN:9780134683416Author:Ron Larson, Betsy FarberPublisher:PEARSON
 The Basic Practice of StatisticsStatisticsISBN:9781319042578Author:David S. Moore, William I. Notz, Michael A. FlignerPublisher:W. H. Freeman
 Introduction to the Practice of StatisticsStatisticsISBN:9781319013387Author:David S. Moore, George P. McCabe, Bruce A. CraigPublisher:W. H. Freeman
MATLAB: An Introduction with Applications
Statistics
ISBN:9781119256830
Author:Amos Gilat
Publisher:John Wiley & Sons Inc
Probability and Statistics for Engineering and th...
Statistics
ISBN:9781305251809
Author:Jay L. Devore
Publisher:Cengage Learning
Statistics for The Behavioral Sciences (MindTap C...
Statistics
ISBN:9781305504912
Author:Frederick J Gravetter, Larry B. Wallnau
Publisher:Cengage Learning
Elementary Statistics: Picturing the World (7th E...
Statistics
ISBN:9780134683416
Author:Ron Larson, Betsy Farber
Publisher:PEARSON
The Basic Practice of Statistics
Statistics
ISBN:9781319042578
Author:David S. Moore, William I. Notz, Michael A. Fligner
Publisher:W. H. Freeman
Introduction to the Practice of Statistics
Statistics
ISBN:9781319013387
Author:David S. Moore, George P. McCabe, Bruce A. Craig
Publisher:W. H. Freeman