
MATLAB: An Introduction with Applications
6th Edition
ISBN: 9781119256830
Author: Amos Gilat
Publisher: John Wiley & Sons Inc
expand_more
expand_more
format_list_bulleted
Related questions
Question
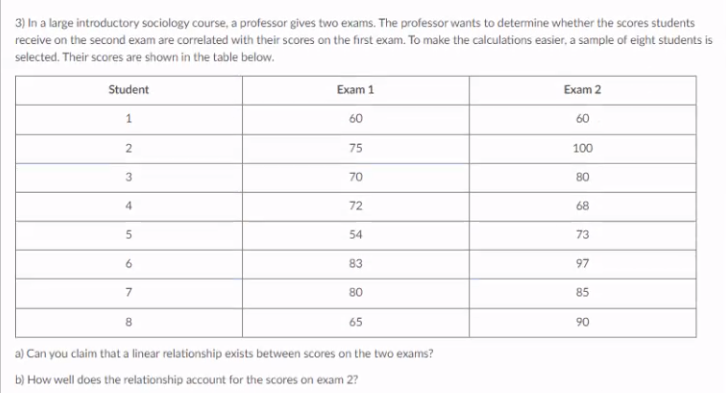

Transcribed Image Text:3) In a large introductory sociology course, a professor gives two exams. The professor wants to determine whether the scores students
receive on the second exam are correlated with their scores on the first exam. To make the calculations easier, a sample of eight students is
selected. Their scores are shown in the table below.
Student
Exam 1
Exam 2
1
60
60
75
100
70
80
4.
72
68
54
73
83
97
80
85
8
65
90
a) Can you claim that a linear relationship exists between scores on the two exams?
b) How well does the relationship account for the scores on exam 2?
Expert Solution
This question has been solved!
Explore an expertly crafted, step-by-step solution for a thorough understanding of key concepts.

This is a popular solution

Trending nowThis is a popular solution!

Step by stepSolved in 4 steps with 3 images

Knowledge Booster

Similar questions
- The data provides information on life expectancy and the number of televisions per thousand people in a sample of 22 countries, as reported by the world almanac and book of facts 2006 A. Describe the Direction and strength of the correlation between the two variables B. Because of the association between the variables, someone might mistakenly conclude that simply sending televisions to the countries with the lower life expectancies would cause their inhabitants to live longer. Comment on this argument and the reason televisions are likely associated with longer life expectancies C. In general, if two variables are strongly associated, does it follow there must be a cause and effect relationship between them? Explainarrow_forwardA university would like to examine the linear relationship between a faculty member's performance rating (measured on a scale of 1-20) and his or her annual salary increase. The table to the right shows these data for eight randomly selected faculty members. Complete parts a and b.arrow_forwardMen's and women's winning national championship bowling scores are shown for a random sample of years. Is there a linear relationship between the men's and women's winning scores? Men 823 858 812 832 833 826 Women 752 754 771 736 792 763 A. There is NOT a linear relationship because the linear correlation coefficient is close to 1 or -1. B. There is NOT a linear relationship because the linear correlation coefficient is close to 0. C. There is a linear relationship because the linear correlation coefficient is close to 0. D. There is a linear relationship because the linear correlation coefficient is close to 1 or -1. Click to select your answer. ?arrow_forward
- The following statement contains an error. Choose the statement that best explains the error. "The correlation between shoe size and height is 0.87 inches" A. Correlation requires that both of the variables be categorical B. When stating the correlation coefficient, one must state whether it is a positive or negative relationship C. This statement does not tell us whether or not shoe size is correlated with height D. When reporting correlation, one does not report units because correlation has no units E. There is no error in this statementarrow_forwardThe following data give the percentage of women working in five companies in the retail and trade industry. The percentage of management jobs held by women in each company is also shown. % Working 67 45 73 54 61 % Management 50 23 63 47 34 (a) Develop a scatter diagram for these data with the percentage of women working in the company as the independent variable. A scatter diagram has 5 points plotted on it. The horizontal axis ranges from 40 to 75 and is labeled: % Working. The vertical axis ranges from 0 to 70 and is labeled: % Management. The first three points are plotted from left to right in an downward, diagonal direction starting in the upper left corner of the diagram. The fourth point extends upward in a diagonal direction to the right. The last point then extends downward from the fourth point in a diagonal direction to the right. The points are between 23 to 63 on the vertical axis. A scatter diagram has 5 points plotted on it. The horizontal axis ranges…arrow_forwardAn economist wants to determine whether there is a linear relationship between a country's gross domestic product (GDP) and carbon dioxide emissions. The data are shown in the table below. c. Compute and interpret the correlation coefficient. d. Compute and interpret the coefficient of determination. e. Test for the significance of the linear relationship. Use a 0.05 level of significance. State your conclusion. Hint: Your conclusion is either of the following. • There is a significant linear relationship between a country's gross domestic product (GDP) and carbon dioxide emissions. • There is no significant linear relationship between a country's gross domestic product (GDP) and carbon dioxide emissions. GDP 1.6 3.6 4.9 1.1 0.9 2.9 2.7 2.3 1.6 1.5 (trillion dollars) Carbon Dioxide Emissions 428.2 828.8 1214.2 444.6 264 415.3 571.8 454.9 358.7 573.5 (millions of metric tons)arrow_forward
- The data set provides a few measures from car models produced in the 1970s. We are focusing on Acceleration as the main outcome variable of interest in this analysis and we would like to examine other variables that may impact Acceleration. For exploring the relationships among the variables, run bivariate correlations for Engine, Horsepower, Weight, and Acceleration. Which variable has the strongest correlation with Acceleration (regardless of direction)?arrow_forwardPlease don't provide handwriting solutionarrow_forwardA researcher found that counties with a high rate of passport ownership also have low rates of obesity, and counties with low rates of passport ownership have high rates of obesity. This is an example of what kind of relationship? Positive Negative Spurious Interveningarrow_forward
- A financial analyst is examining the relationship between stock prices and earnings per share. She chooses sixteen publicly traded companies at random and records for each the company's current stock price and the company's earnings per share reported for the past 12 months. Her data are given below, with x denoting the earnings per share from the previous year and y denoting the current stock price (both in dollars). A scatter plot of her data is shown in Figure 1. Also given is the product of the earnings per share and the current stock price for each of the sixteen stocks. (These products, written in the column labelled "xy ", may aid in calculations.) Earnings per share, x (in dollars) 36.79 49.84 30.65 30.17 17.66 57.66 37.98 20.65 58.67 13.52 41.83 39.28 43.73 Current stock price, y (in dollars) 1.43 1.56 0.81 1.40 0.77 2.64 1.11 0.70 2.18 0.41 1.80 1.05 1.63 ху 52.6097 77.7504 24.8265 42.238 13.5982 152.2224 42.1578 14.455 127.9006 5.5432 75.294 41.244 71.2799 Current stock…arrow_forwardTwo separate tests are designed to measure a student's ability to solve problems. Several students are randomly selected to take both tests and the results are shown below. Test A (x) 43 65 73 34 99 78 65 Test B (y) 39 60 62 20 85 70 54 1. Calculate r, the linear correlation coefficient. Identify the values for each part below. Part a. The value of n Part b. The sum of the x-values Part c. The sum of the y-values Part d. The sum of the x-squared values Part e. The sum of the y-squared values Part f. The sum of the (xy) values Part g. The final value of r rounded top three decimal placesarrow_forwardAfter gathering data about the number of starfish and measuring the pollution in areas of the ocean you find a negative linear correlation between pollution levels and number of starfish. What can you conclude based on this information? a. There is a confounding variable that is affecting both pollution and starfish. b. As pollution rises the number of starfish falls c. That pollution is causing starfish to die, leading to the negative correlation d. That pollution is supporting starfish, leading to the negative correlationarrow_forward
arrow_back_ios
SEE MORE QUESTIONS
arrow_forward_ios
Recommended textbooks for you
- MATLAB: An Introduction with ApplicationsStatisticsISBN:9781119256830Author:Amos GilatPublisher:John Wiley & Sons Inc
 Probability and Statistics for Engineering and th...StatisticsISBN:9781305251809Author:Jay L. DevorePublisher:Cengage Learning
 Statistics for The Behavioral Sciences (MindTap C...StatisticsISBN:9781305504912Author:Frederick J Gravetter, Larry B. WallnauPublisher:Cengage Learning
  Elementary Statistics: Picturing the World (7th E...StatisticsISBN:9780134683416Author:Ron Larson, Betsy FarberPublisher:PEARSON
 The Basic Practice of StatisticsStatisticsISBN:9781319042578Author:David S. Moore, William I. Notz, Michael A. FlignerPublisher:W. H. Freeman
 Introduction to the Practice of StatisticsStatisticsISBN:9781319013387Author:David S. Moore, George P. McCabe, Bruce A. CraigPublisher:W. H. Freeman
MATLAB: An Introduction with Applications
Statistics
ISBN:9781119256830
Author:Amos Gilat
Publisher:John Wiley & Sons Inc
Probability and Statistics for Engineering and th...
Statistics
ISBN:9781305251809
Author:Jay L. Devore
Publisher:Cengage Learning
Statistics for The Behavioral Sciences (MindTap C...
Statistics
ISBN:9781305504912
Author:Frederick J Gravetter, Larry B. Wallnau
Publisher:Cengage Learning
Elementary Statistics: Picturing the World (7th E...
Statistics
ISBN:9780134683416
Author:Ron Larson, Betsy Farber
Publisher:PEARSON
The Basic Practice of Statistics
Statistics
ISBN:9781319042578
Author:David S. Moore, William I. Notz, Michael A. Fligner
Publisher:W. H. Freeman
Introduction to the Practice of Statistics
Statistics
ISBN:9781319013387
Author:David S. Moore, George P. McCabe, Bruce A. Craig
Publisher:W. H. Freeman