
MATLAB: An Introduction with Applications
6th Edition
ISBN: 9781119256830
Author: Amos Gilat
Publisher: John Wiley & Sons Inc
expand_more
expand_more
format_list_bulleted
Related questions
Question
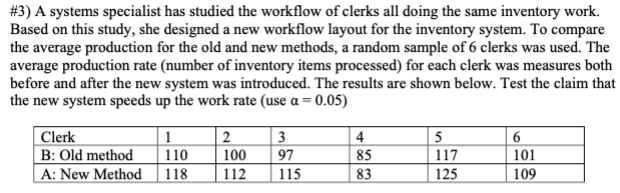

Transcribed Image Text:#3) A systems specialist has studied the workflow of clerks all doing the same inventory work.
Based on this study, she designed a new workflow layout for the inventory system. To compare
the average production for the old and new methods, a random sample of 6 clerks was used. The
average production rate (number of inventory items processed) for each clerk was measures both
before and after the new system was introduced. The results are shown below. Test the claim that
the new system speeds up the work rate (use a = 0.05)
Clerk
B: Old method
A: New Method
4
85
3
97
2
110
100
117
101
118
112
115
83
125
109
Expert Solution
This question has been solved!
Explore an expertly crafted, step-by-step solution for a thorough understanding of key concepts.

This is a popular solution

Trending nowThis is a popular solution!

Step by stepSolved in 5 steps with 5 images

Knowledge Booster

Similar questions
- A manufacturing firm produces its products in batches using sophisticated machines and equipment. The general manager wanted to investigate the relationship between direct labor costs and the number of units produced per batch. The recorded the data from the last 30 batches is below Batch Size Labor Cost Batch Size Labor Cost (5) 25 34 19 31 39 21 21 19 40 36 34 29 26 36 423 415 447 430 340 317 362 452 464 438 420 400 469 25 39. 25*8585& 29 31 21 36 39 29 41 35. 21 29 25 395 88888883 429 440 420 400 425 420 401 451 422 410 395 409 Determine the fixed and variable labor costs (Round your answers to the nearest cent) fixed cost 5 variable labor costarrow_forwardFiske Corporation manufactures a popular regional brand of kitchen utensils. The design and variety has been fairly constant over the last three years. The managers at Fiske are planning for some changes in the product line next year, but first they want to understand better the relation between activity and factory costs as experienced with the current products. Discussions with the plant supervisor suggest that overhead seems to vary with labor-hours, machine-hours, or both. The following data were collected from last three year's operations: Quarter Machine-Hours 18,850 4 5 6 7 8 9 10 11 12 18,590 17,480 19,240 21,280 19,630 19,240 18,850 18,460 20,670 17,550 18,460 Labor-Hours 15,605 15,484 16,727 15,990 17,508 17,376 15,297 14,373 16,001 17,002 14,285 17,651 Factory costs $ 3,395,671 3,425,836 3,617,844 3,573,940 3,812,984 3,778,012 3,532,426 3,369,802 3,513, 187 3,731,434 3,325,615 3,724,486 Required: Prepare a scatter graph based on the factory cost and labor-hour data. Note: 1.…arrow_forwardMost supermarkets use scanners at the checkout counters. The data collected this way can be used to evaluate the effect of price and store's promotional activities on the sales of any product. The promotions at a store change weekly, and are mainly of two types: flyers distributed outside the store and through newspapers (which may or may not include that particular product), and in-store displays at the end of an aisle that call the customers' attention to the product. Weekly data was collected on a particular beverage brand, including sales (in number of units), price (in dollars), flyer (1 if product appeared that week, 0 if it didn't) and display (1 if a special display of the product was used that week, 0 if it wasn't).As a preliminary analysis, a simple linear regression model was done. The fitted regression equation was: sales = 2259 - 1418 price. The ANOVA F test p-value was .000, and r squared = 59.7%.According to this model, how many units will be sold, on average, when the…arrow_forward
- As a sales analyst for the shoe retailer Foot Locker, one of your responsibilities is measuring store productivity and then reporting your conclusion back to management. Foot Locker uses sales per square foot as a measure of store productivity. While preparing your report for the second quarter results (Q2), you are able to determine that annual sales for last year ran at a rate of $406 per square foot. Therefore, $406 per square foot will be your sales estimate for the population of all Foot Locker stores during Q2. For your Q2 Sales Report, you decide to take a random sample of 64 stores. Using annual data from last year, you are able to determine that the standard deviation for sales per square foot for all 3,400 stores was $80. Therefore $80 per square foot will be your population standard deviation when compiling your Q2 report. Management has asked for the probability that your sample mean based on 64 stores is 1) within $15 and 2) within $5 of the population mean…arrow_forwardAs a sales analyst for the shoe retailer Foot Locker, one of your responsibilities is measuring store productivity and then reporting your conclusion back to management. Foot Locker uses sales per square foot as a measure of store productivity. While preparing your report for the second quarter results (Q2), you are able to determine that annual sales for last year ran at a rate of $406 per square foot. Therefore, $406 per square foot will be your sales estimate for the population of all Foot Locker stores during Q2. For your Q2 Sales Report, you decide to take a random sample of 64 stores. Using annual data from last year, you are able to determine that the standard deviation for sales per square foot for all 3,400 stores was $80. Therefore $80 per square foot will be your population standard deviation when compiling your Q2 report. You anticipate that management would be comfortable with a probability of 0.500 when offering your estimate of the sample mean. Using σ = $80…arrow_forwardA1 1 2 3 7 5 5 7 B 9 0 1 2 3 4 5 6 7 8 9 0 1 2 3 4 5 6 7 8 9 0 1 2 A Day 1 2 3 4 5 6 7 8 9 10 11 12 13 14 15 16 17 18 19 20 21 22 23 24 25 26 27 28 29 30 X B Discharged_Patients A 54 63 110 105 131 137 80 63 75 92 105 112 120 95 72 128 126 106 129 136 94 74 107 135 124 113 140 83 62 106 fx Day с Records_not_Processed 18 18 52 29 70 57 26 29 14 27 49 38 47 26 28 49 45 39 27 38 44 25 29 62 44 60 46 38 25 39 D E F G H I Jarrow_forward
- Assume that a sample is used to estimate a population mean μμ. Find the 80% confidence interval for a sample of size 46 with a mean of 15.6 and a standard deviation of 10.2. Enter your answer as an open-interval (i.e., parentheses) accurate to 3 decimal places.80% C.I. = The answer should be obtained without any preliminary rounding.arrow_forwardOverweight or obese adults from psychiatric programs were recruited and randomly assigned to a treatment group or control group. Patients in the treatment group received both weight-management sessions plus exercise sessions plus their usual care. Patients in the control group received their usual treatment for mental illness and no additional treatment. After 18 months, some of the patients had lost 5% or more of their weight, and some had not. The table summarizes the data. Complete parts (a) and (b) below. Treatment Group Control Group Lost 5% or more 46 29 Did not lose 5% or more 88 106 ..... (a) Find the percentage of each group that lost 5% or more, and compare them descriptively. That is, report both percentages, and indicate what these sample percentages suggest about the effectiveness of the treatment program. Of the treatment group,% of them lost 5% or more. (Round to one decimal place as needed.) Of the control group, % of them lost 5% or more. (Round to one decimal place as…arrow_forward
arrow_back_ios
arrow_forward_ios
Recommended textbooks for you
- MATLAB: An Introduction with ApplicationsStatisticsISBN:9781119256830Author:Amos GilatPublisher:John Wiley & Sons Inc
 Probability and Statistics for Engineering and th...StatisticsISBN:9781305251809Author:Jay L. DevorePublisher:Cengage Learning
 Statistics for The Behavioral Sciences (MindTap C...StatisticsISBN:9781305504912Author:Frederick J Gravetter, Larry B. WallnauPublisher:Cengage Learning
  Elementary Statistics: Picturing the World (7th E...StatisticsISBN:9780134683416Author:Ron Larson, Betsy FarberPublisher:PEARSON
 The Basic Practice of StatisticsStatisticsISBN:9781319042578Author:David S. Moore, William I. Notz, Michael A. FlignerPublisher:W. H. Freeman
 Introduction to the Practice of StatisticsStatisticsISBN:9781319013387Author:David S. Moore, George P. McCabe, Bruce A. CraigPublisher:W. H. Freeman
MATLAB: An Introduction with Applications
Statistics
ISBN:9781119256830
Author:Amos Gilat
Publisher:John Wiley & Sons Inc
Probability and Statistics for Engineering and th...
Statistics
ISBN:9781305251809
Author:Jay L. Devore
Publisher:Cengage Learning
Statistics for The Behavioral Sciences (MindTap C...
Statistics
ISBN:9781305504912
Author:Frederick J Gravetter, Larry B. Wallnau
Publisher:Cengage Learning
Elementary Statistics: Picturing the World (7th E...
Statistics
ISBN:9780134683416
Author:Ron Larson, Betsy Farber
Publisher:PEARSON
The Basic Practice of Statistics
Statistics
ISBN:9781319042578
Author:David S. Moore, William I. Notz, Michael A. Fligner
Publisher:W. H. Freeman
Introduction to the Practice of Statistics
Statistics
ISBN:9781319013387
Author:David S. Moore, George P. McCabe, Bruce A. Craig
Publisher:W. H. Freeman