MATLAB: An Introduction with Applications
6th Edition
ISBN: 9781119256830
Author: Amos Gilat
Publisher: John Wiley & Sons Inc
expand_more
expand_more
format_list_bulleted
Question

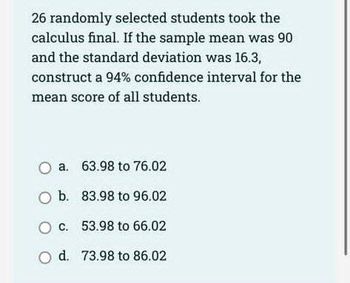
Transcribed Image Text:26 randomly selected students took the
calculus final. If the sample mean was 90
and the standard deviation was 16.3,
construct a 94% confidence interval for the
mean score of all students.
O a.
O b.
O c.
O d.
63.98 to 76.02
83.98 to 96.02
53.98 to 66.02
73.98 to 86.02
Expert Solution
This question has been solved!
Explore an expertly crafted, step-by-step solution for a thorough understanding of key concepts.
This is a popular solution
Trending nowThis is a popular solution!
Step by stepSolved in 2 steps with 2 images

Knowledge Booster
Similar questions
- Subject - account Please help me. Thankyou.arrow_forward83 students are asked in a survey how many hours they work during a week. Their responses have a mean of 19 hours and a standard deviation of 2 hours. Find the margin of error for a 80 % confidence interval. Round your answer in two decimal placesarrow_forwardIn a random sample of five people, the mean driving distance to work was 25.1 miles and the standard deviation was 6.6 miles. Assume the population is normally distributed and use the t-distribution to find the margin of error and construct a 95% confidence interval for the population mean p. Interpret the results. * *I Identify the margin of error. miles (Round to one decimal place as needed.) rary More Clear all Check answer Get more help - Media View an example ess Help me solve this ESources 58°F A @ S 6. ress e here to search 10/05/17arrow_forward
- You sample 36 students to find out how many hours they spent online last week. Your sample mean is 54. The population standard deviation, sigma, is 8.2. Your client now wants the 90% confidence interval for this sample mean. It is: 40.1 to 67.9 51.8 to 56.2 40.5 to 67.5 51.0 to 56.0arrow_forwardmean. Interpret the results and compare the widths of the confidence intervals. If convenient, use technology to construct the confidence intervals. A random sample of 40 home theater systems has a mean price of $138.00. Assume the population standard deviation is $17.80. Construct a 90% confidence interval for the population mean.arrow_forwardYou are given the smaple mean and the population m standard deviation. Use this info to construct the 90% and 95% confidence intervals for the population mean. Interpert the results and compare the widths of the confidence intervals. A random sample of 50 home theater systems has a mean price of $145. Assume the population standard deviation is $17.30arrow_forward
- You are given the sample mean and the population standard deviation. Use this information to construct the 90% and 95% confidence intervals for the population mean. Interpret the results and compare the widths of the confidence intervals. From a random sample of 49 business days, the mean closing price of a certain stock was $109.89 . Assume the population standard deviation is $10.27 .arrow_forwardTina catches a 14-pound bass. She does not know the population mean or standard deviation. So she takes a sample of five friends and they say the last bass they caught was 9, 12, 13, 10, and 10 pounds. Find the t and calculate a 95% (α = .05) confidence interval.arrow_forwardA random sample of 12 cats was collected to study the lifespan with the data listed below. Find the 87% confidence interval for the population mean. Round all values to two decimals. 13, 15, 18, 16, 8, 12, 13, 15, 8, 13, 12, 11. Provide your answer below.arrow_forward
- In a survey, 28 people were asked how much they spent on their child's last birthday gift. The results were roughly bell-shaped with a mean of $45 and standard deviation of $14. Construct a confidence interval at a 99% confidence level. Give your answers to one decimal place. ________+________arrow_forwardLook at the picturearrow_forwardYou are given the sample mean and the population standard deviation. Use this information to construct the 90% and 95% confidence intervals for the population mean. Interpret the results and compare the widths of the confidence intervals. From a random sample of 38 business days, the mean closing price of a certain stock was $119.97. Assume the population standard deviation is $10.88.arrow_forward
arrow_back_ios
SEE MORE QUESTIONS
arrow_forward_ios
Recommended textbooks for you
 MATLAB: An Introduction with ApplicationsStatisticsISBN:9781119256830Author:Amos GilatPublisher:John Wiley & Sons Inc
 Probability and Statistics for Engineering and th...StatisticsISBN:9781305251809Author:Jay L. DevorePublisher:Cengage Learning
 Statistics for The Behavioral Sciences (MindTap C...StatisticsISBN:9781305504912Author:Frederick J Gravetter, Larry B. WallnauPublisher:Cengage Learning
 Elementary Statistics: Picturing the World (7th E...StatisticsISBN:9780134683416Author:Ron Larson, Betsy FarberPublisher:PEARSON
 The Basic Practice of StatisticsStatisticsISBN:9781319042578Author:David S. Moore, William I. Notz, Michael A. FlignerPublisher:W. H. Freeman
 Introduction to the Practice of StatisticsStatisticsISBN:9781319013387Author:David S. Moore, George P. McCabe, Bruce A. CraigPublisher:W. H. Freeman

MATLAB: An Introduction with Applications
Statistics
ISBN:9781119256830
Author:Amos Gilat
Publisher:John Wiley & Sons Inc

Probability and Statistics for Engineering and th...
Statistics
ISBN:9781305251809
Author:Jay L. Devore
Publisher:Cengage Learning

Statistics for The Behavioral Sciences (MindTap C...
Statistics
ISBN:9781305504912
Author:Frederick J Gravetter, Larry B. Wallnau
Publisher:Cengage Learning

Elementary Statistics: Picturing the World (7th E...
Statistics
ISBN:9780134683416
Author:Ron Larson, Betsy Farber
Publisher:PEARSON

The Basic Practice of Statistics
Statistics
ISBN:9781319042578
Author:David S. Moore, William I. Notz, Michael A. Fligner
Publisher:W. H. Freeman

Introduction to the Practice of Statistics
Statistics
ISBN:9781319013387
Author:David S. Moore, George P. McCabe, Bruce A. Craig
Publisher:W. H. Freeman