MATLAB: An Introduction with Applications
6th Edition
ISBN: 9781119256830
Author: Amos Gilat
Publisher: John Wiley & Sons Inc
expand_more
expand_more
format_list_bulleted
Question
thumb_up100%

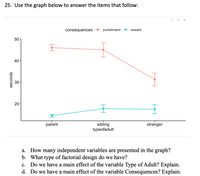
Transcribed Image Text:25. Use the graph below to answer the items that follow:
consequences
punishment + reward
50
40
30
20
sibling
typeofadult
parent
stranger
a. How many independent variables are presented in the graph?
b. What type of factorial design do we have?
Do we have a main effect of the variable Type of Adult? Explain.
d. Do we have a main effect of the variable Consequences? Explain.
с.
seconds
Expert Solution
This question has been solved!
Explore an expertly crafted, step-by-step solution for a thorough understanding of key concepts.
Step by stepSolved in 2 steps with 1 images

Knowledge Booster
Learn more about
Need a deep-dive on the concept behind this application? Look no further. Learn more about this topic, statistics and related others by exploring similar questions and additional content below.Similar questions
- 13arrow_forwardA fundraiser is offering a small gift to people making a donation. The donor can choose one of four gifts: a mug, a t-shirt, a plush toy, or a water bottle. The fundraiser would like to know if any of the gifts were more or less popular or were they equal in preference. The data for n = 40 donors are below:arrow_forwardSteps and explanationarrow_forward
- Short Answer 3: Thirty students were surveyed as to their ethnicity, and the following was the data: Hisp. White Asian Hisp. Afr. White Afr. Hisp. Asian Hisp. Hisp. White White White Hisp. White Afr. Hisp. Hisp. Hisp. Hisp. White Hisp. White Afr. White Afr. Hisp. White Hisp. Graph a bar chart and a pie chart BY HAND, and upload them to this question using the "File Upload" feature!arrow_forwardThe book The Wall Street Journal. Guide to Information Graphics by Dona M. Wong gives strategies for using graphs and charts to display information effectively. One popular graph discussed is the donut pie chart. The donut pie chart is simply a pie chart with the center removed. A recent Harris Poll asked adults about their opinions regarding whether books should be banned from libraries because of social, language, violent, sexual, or religious content. The responses by education level to the question "Do you think that there are any books which should be banned completely?" are shown in the following donut pie charts. (a) What feature of Keith's graph makes it difficult to visually compare the responses of those with some college to those shown in the other graphs? (Select all that apply.) a)The graphs made by Keith and Ramon compare groups across education level. b)The graphs made by Keith and Ramon are all donut pie charts. c)The graphs do not have data labels showing the…arrow_forwardDraw a weighted graph that represents this scenario.arrow_forward
- A random sample of n=102 was asked what color they most liked to wear as one question in a survey. What type of graph would be best to display the data below? Note: please do not capitalize your answers when typing them. Color Blue Green Red Purple Yellow Orange # of people 20 15 32 18 15 pie graph histogram O box-and-whiskersarrow_forwardHelp.arrow_forwardC2. Using the information listed below, explore the educational attainment of GSS 2018 respondents. Frequencies and percentages are reported by sex of respondent. a. Calculate the IQR for both groups. What do the IQRS reveal about the degree of diversity for males and females? b. What is the limitation to applying IQR to ordinal data? Highest Educational Degree Males Females Less than high school 63 80 12.9% 12.7% High school graduate 256 296 52.5% 47.1% Junior college 30 72 6.1% 11.4% Bachelor's degree 90 111 18.4% 17.6% Graduate degree 49 70 10% 11.1% 488 629 Total 100% 100% CHAPTER 4 MEASURES Carrow_forward
arrow_back_ios
arrow_forward_ios
Recommended textbooks for you
 MATLAB: An Introduction with ApplicationsStatisticsISBN:9781119256830Author:Amos GilatPublisher:John Wiley & Sons Inc
 Probability and Statistics for Engineering and th...StatisticsISBN:9781305251809Author:Jay L. DevorePublisher:Cengage Learning
 Statistics for The Behavioral Sciences (MindTap C...StatisticsISBN:9781305504912Author:Frederick J Gravetter, Larry B. WallnauPublisher:Cengage Learning
 Elementary Statistics: Picturing the World (7th E...StatisticsISBN:9780134683416Author:Ron Larson, Betsy FarberPublisher:PEARSON
 The Basic Practice of StatisticsStatisticsISBN:9781319042578Author:David S. Moore, William I. Notz, Michael A. FlignerPublisher:W. H. Freeman
 Introduction to the Practice of StatisticsStatisticsISBN:9781319013387Author:David S. Moore, George P. McCabe, Bruce A. CraigPublisher:W. H. Freeman

MATLAB: An Introduction with Applications
Statistics
ISBN:9781119256830
Author:Amos Gilat
Publisher:John Wiley & Sons Inc

Probability and Statistics for Engineering and th...
Statistics
ISBN:9781305251809
Author:Jay L. Devore
Publisher:Cengage Learning

Statistics for The Behavioral Sciences (MindTap C...
Statistics
ISBN:9781305504912
Author:Frederick J Gravetter, Larry B. Wallnau
Publisher:Cengage Learning

Elementary Statistics: Picturing the World (7th E...
Statistics
ISBN:9780134683416
Author:Ron Larson, Betsy Farber
Publisher:PEARSON

The Basic Practice of Statistics
Statistics
ISBN:9781319042578
Author:David S. Moore, William I. Notz, Michael A. Fligner
Publisher:W. H. Freeman

Introduction to the Practice of Statistics
Statistics
ISBN:9781319013387
Author:David S. Moore, George P. McCabe, Bruce A. Craig
Publisher:W. H. Freeman