
MATLAB: An Introduction with Applications
6th Edition
ISBN: 9781119256830
Author: Amos Gilat
Publisher: John Wiley & Sons Inc
expand_more
expand_more
format_list_bulleted
Related questions
Question
What is Ha?
Choice Answers:
1. The mean of group 1 is not the same as the mean of group 2
2. The mean of group 1 is the same as the mean of group 2
3. The number of errors for 8 hours sleep deprivation is different than the number of errors for 24 hours sleep deprivation
4. The number of errors for 8 hours sleep deprivation is equal to the number of errors for 24 hours sleep deprivation
5. The number of errors for 8 hours sleep deprivation is not different than the number of errors for 24 hours sleep deprivation
6. The number of errors for 8 hours sleep deprivation is not equal to the number of errors for 24 hours sleep deprivation
7. The number of errors for 8 hours sleep deprivation is not the same as the number of errors for 24 hours sleep deprivation
8. The number of errors for 8 hours sleep deprivation is the same as the number of errors for 24 hours sleep deprivation
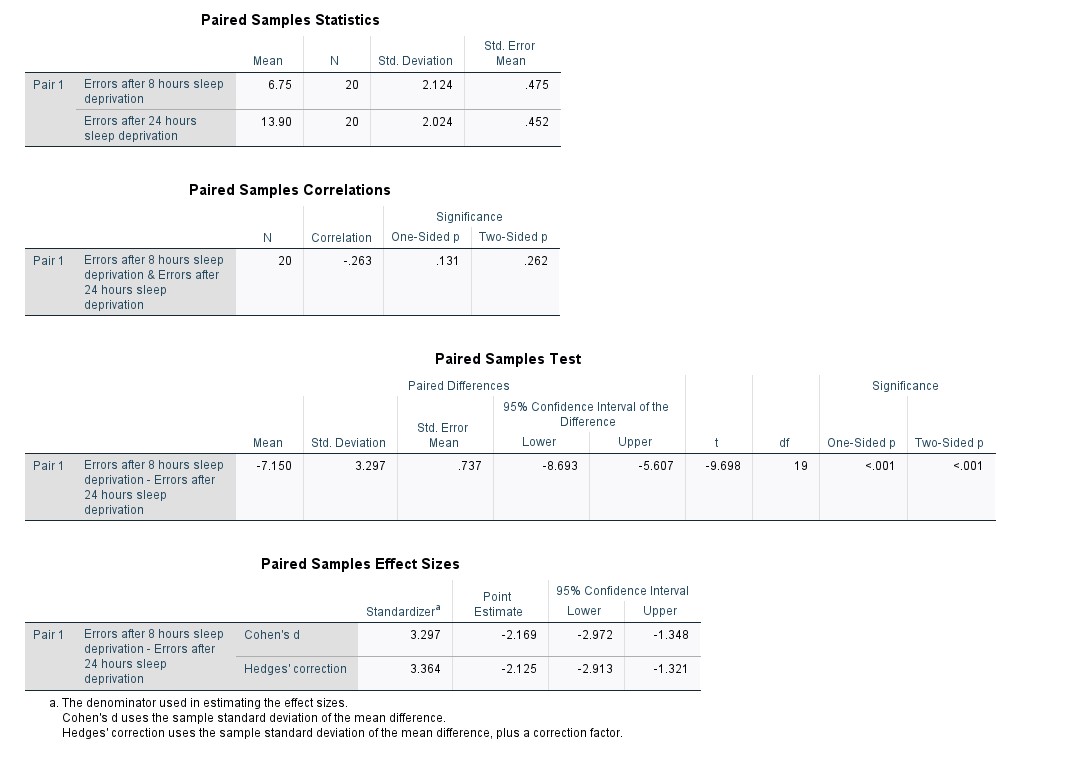

Transcribed Image Text:### Paired Samples Analysis
#### Paired Samples Statistics
This section presents the statistics for errors made after different durations of sleep deprivation:
- **Errors after 8 hours sleep deprivation**:
- Mean = 6.75
- Sample Size (N) = 20
- Standard Deviation = 2.124
- Standard Error Mean = 0.475
- **Errors after 24 hours sleep deprivation**:
- Mean = 13.90
- Sample Size (N) = 20
- Standard Deviation = 2.024
- Standard Error Mean = 0.452
#### Paired Samples Correlations
This analysis shows the correlation between errors after 8 hours and 24 hours of sleep deprivation:
- **Correlation (r) = -0.263**
- Sample Size (N) = 20
- Significance (One-Sided p) = 0.131
- Significance (Two-Sided p) = 0.262
A negative correlation indicates an inverse relationship, but it is not statistically significant.
#### Paired Samples Test
This test compares the mean difference of errors between the two conditions:
- **Mean of Differences = -7.150**
- Standard Deviation of Differences = 3.297
- Standard Error Mean = 0.737
- 95% Confidence Interval of the Difference: Lower = -8.693, Upper = -5.607
- **t-value** = -9.698
- Degrees of Freedom (df) = 19
- Significance:
- One-Sided p < 0.001
- Two-Sided p < 0.001
The results indicate a highly significant difference in the number of errors, with fewer errors after 8 hours of sleep deprivation compared to 24 hours.
#### Paired Samples Effect Sizes
This section provides the effect sizes with two metrics:
- **Cohen's d**:
- Standardizer = 3.297
- Point Estimate = -2.169
- 95% Confidence Interval: Lower = -2.972, Upper = -1.348
- **Hedges' correction**:
- Standardizer = 3.364
- Point Estimate = -2.125
- 95% Confidence Interval: Lower = -2.913, Upper = -1.321
C
Expert Solution
arrow_forward
Step 1
Given :

Step by stepSolved in 5 steps with 5 images

Knowledge Booster

Similar questions
- Q.5. Find the median if the mean and mode are given as 35 and 30 respectively?arrow_forwardwhat is the median numbers of beads in a box?arrow_forward3. You would like to determine if there is a statistical relationship between the amount of caffein in a cup of coffee and their sales at their coffee franchises. The data is included in the set "Coffee by the Cup". Here is information about the variables. Variable Caffeine Cups Sold Measurement Amount of caffeine in one cup Number of cups of the coffee Units Milligrams Cups sold sold at all of the franchises a. Which variable is the explanatory variable and which variable is the response variable? b. Construct a scatterplot of the data. Based upon the scatterplot is there a linear relationship between the amount of caffeine in one cup of the coffee and the number of cups of coffee sold? Justify your reasoning using the scatterplot. c. Run a t-test for correlation using technology. Make sure you include the p-value and the printout. According to the t-test, is there a statistical relationship between the amount of caffeine in a cup of coffee and the number of cups sold? Justify your…arrow_forward
- The table below shows the number of books the Jefferson Middle school students readeach month for nine months. If the students read only 101 books for the month of June, which measure of central tendency will have the greatest change?A. All measures will have an equal change.B. The median will have the greatest change.C. The mean will have the greatest change.D. The mode will have the greatest change.arrow_forward1) The question screenshot attached down below answer all and just need final answerarrow_forwardSuppose there are 5 students in a room. The mean age is 19.8 years, and the median age is 19. If the youngest person leaves and is not replaced by another person, what happens to the mean and the median? O The mean and median increase. The mean increases, and the median either increases or stays the same. The mean increases, but it is impossible to determine whether the median increases, decreases, or stays the same. The mean increases, and the median stays the same. The median increases, and the mean either increases or stays the same.arrow_forward
arrow_back_ios
arrow_forward_ios
Recommended textbooks for you
- MATLAB: An Introduction with ApplicationsStatisticsISBN:9781119256830Author:Amos GilatPublisher:John Wiley & Sons Inc
 Probability and Statistics for Engineering and th...StatisticsISBN:9781305251809Author:Jay L. DevorePublisher:Cengage Learning
 Statistics for The Behavioral Sciences (MindTap C...StatisticsISBN:9781305504912Author:Frederick J Gravetter, Larry B. WallnauPublisher:Cengage Learning
  Elementary Statistics: Picturing the World (7th E...StatisticsISBN:9780134683416Author:Ron Larson, Betsy FarberPublisher:PEARSON
 The Basic Practice of StatisticsStatisticsISBN:9781319042578Author:David S. Moore, William I. Notz, Michael A. FlignerPublisher:W. H. Freeman
 Introduction to the Practice of StatisticsStatisticsISBN:9781319013387Author:David S. Moore, George P. McCabe, Bruce A. CraigPublisher:W. H. Freeman
MATLAB: An Introduction with Applications
Statistics
ISBN:9781119256830
Author:Amos Gilat
Publisher:John Wiley & Sons Inc
Probability and Statistics for Engineering and th...
Statistics
ISBN:9781305251809
Author:Jay L. Devore
Publisher:Cengage Learning
Statistics for The Behavioral Sciences (MindTap C...
Statistics
ISBN:9781305504912
Author:Frederick J Gravetter, Larry B. Wallnau
Publisher:Cengage Learning
Elementary Statistics: Picturing the World (7th E...
Statistics
ISBN:9780134683416
Author:Ron Larson, Betsy Farber
Publisher:PEARSON
The Basic Practice of Statistics
Statistics
ISBN:9781319042578
Author:David S. Moore, William I. Notz, Michael A. Fligner
Publisher:W. H. Freeman
Introduction to the Practice of Statistics
Statistics
ISBN:9781319013387
Author:David S. Moore, George P. McCabe, Bruce A. Craig
Publisher:W. H. Freeman