
MATLAB: An Introduction with Applications
6th Edition
ISBN: 9781119256830
Author: Amos Gilat
Publisher: John Wiley & Sons Inc
expand_more
expand_more
format_list_bulleted
Related questions
Question
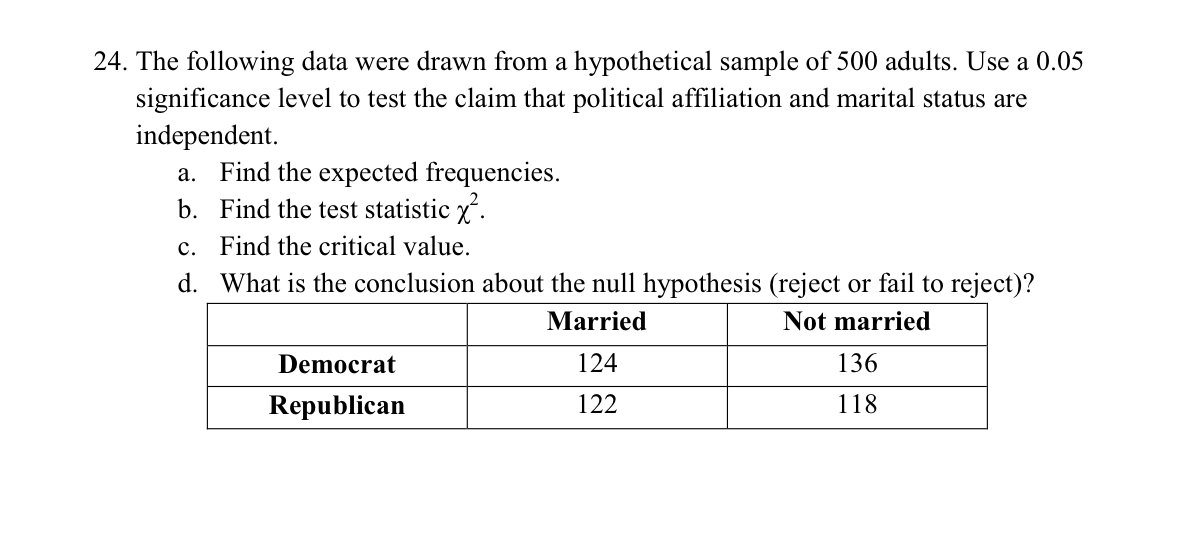

Transcribed Image Text:24. The following data were drawn from a hypothetical sample of 500 adults. Use a 0.05
significance level to test the claim that political affiliation and marital status are
independent.
a. Find the expected frequencies.
b. Find the test statistic x.
c. Find the critical value.
d. What is the conclusion about the null hypothesis (reject or fail to reject)?
Married
Not married
Democrat
124
136
Republican
122
118
Expert Solution
This question has been solved!
Explore an expertly crafted, step-by-step solution for a thorough understanding of key concepts.

This is a popular solution

Trending nowThis is a popular solution!

Step by stepSolved in 4 steps

Knowledge Booster

Similar questions
- 6. A sample of 100 adult women was taken, and each was asked how many children she had. The results were as follows: Children 0 Number of 24 Women 1 20 2 35 3 13 4 7 5 1 a. Find the sample mean number of children. b. Find the sample standard deviation of the number of children. c. Find the sample median of the number of children. d. What is the first quartile of the number of children? e. What proportion of the women had more than the mean number of children? f. For what proportion of the women was the number of children more than one standard deviation greater than the mean? g. For what proportion of the women was the number of children within one standard deviation of the mean?arrow_forward2. Jim Miller works in the personnel department for a car company. He is told by his supervisor to investigate the difference in the average number of sick days between blue collar workers and whitecollar workers. So he obtained a random sample of 9 blue collar workers and a random sample of 9 white collar workers. He records the results below.At 10% level of significance, is there sufficient evidence to indicate a difference in mean sick days between blue collar workers and white collar workers.arrow_forwardThe city of Hampton is surveying households to see if the number of cats per household has changed over the past decade. The last known average of cats per household was 1.08. What statistical procedure should you use to analyze these data? O one sample z test Oone sample t test O correlated groups t test O independent groups t testarrow_forward
- The U.S. National Center for Health Statistics complies birth statistics and publishes the results in vital statistics of the United States. The Center has historically believed that the mean of all newborns in the U.S. has been no less than 6.95 pounds. A sample of babies is selected so that the center can revise its belief. The following birth weights, in pounds are recorded: 7.4, 6.0, 8.6, 4.5, 2.0, 7.9, 4.0, 2.6, 5.9, 7.3, 7.3, 7.0, 6.3, 8.1, 7.1, 7.3, 6.6, 5.2, 9.8, 8.0, 10.9, 6.5, 3.8, 5.0, 8.0 a). At 5% level of significance, do these data provide sufficient evidence to refute the Center’s belief? Your conclusion must be in terms of the P-Value as well as setting up a Rejection Region. You must show all necessary work. b). Which statistical distribution should be applied in this situation and why? Explain carefully.arrow_forward3. Health officials from DOH who have studied a particular virus say that 50% of all the Filipino people have had the virus. If a random sample of 144 people is taken, what is the mean value? a. 43 b. 57 c. 72 d. 84arrow_forwardA hospital has a main campus and three satellite locations. Management wants to reduce waiting time for ER cases. A random sample of 11 ER cases at each location was selected, and the waiting time was measured. Excel.) Complete parts (a) through (d) to determine if there is statistical evidence of a difference in the mean waiting times betweeen the four locations. a. State the two hypotheses. Choose the correct answer below. O B. Ho: H1 = H2 = ••• = H4 H;: 41 H2# • • • # µ4 O A. Ho: H1 =H2 = ••• = H4 H;: Not all H are equal (where j= 1,2,.4) OC. Họ: H1 = H2 = • •• = H1 H;: 41 # H2# • •• #H11 D. Ho: H1 = H2= • •• - H11 H;: Not all H; are equal (where j= 1,2,.,11) b. At the 0.05 level of significance, state the test statistic. (Round to two decimal places to the right of the decimal point as needed.) O A. FSTAT = 0.005 , from the first row of the ANOVA table O B. FSTAT = 4.91 , from the first row of the ANOVA table O C. FSTAT = 2.05 , from the first row of the ANOVA table O D. FSTAT =…arrow_forward
arrow_back_ios
arrow_forward_ios
Recommended textbooks for you
- MATLAB: An Introduction with ApplicationsStatisticsISBN:9781119256830Author:Amos GilatPublisher:John Wiley & Sons Inc
 Probability and Statistics for Engineering and th...StatisticsISBN:9781305251809Author:Jay L. DevorePublisher:Cengage Learning
 Statistics for The Behavioral Sciences (MindTap C...StatisticsISBN:9781305504912Author:Frederick J Gravetter, Larry B. WallnauPublisher:Cengage Learning
  Elementary Statistics: Picturing the World (7th E...StatisticsISBN:9780134683416Author:Ron Larson, Betsy FarberPublisher:PEARSON
 The Basic Practice of StatisticsStatisticsISBN:9781319042578Author:David S. Moore, William I. Notz, Michael A. FlignerPublisher:W. H. Freeman
 Introduction to the Practice of StatisticsStatisticsISBN:9781319013387Author:David S. Moore, George P. McCabe, Bruce A. CraigPublisher:W. H. Freeman
MATLAB: An Introduction with Applications
Statistics
ISBN:9781119256830
Author:Amos Gilat
Publisher:John Wiley & Sons Inc
Probability and Statistics for Engineering and th...
Statistics
ISBN:9781305251809
Author:Jay L. Devore
Publisher:Cengage Learning
Statistics for The Behavioral Sciences (MindTap C...
Statistics
ISBN:9781305504912
Author:Frederick J Gravetter, Larry B. Wallnau
Publisher:Cengage Learning
Elementary Statistics: Picturing the World (7th E...
Statistics
ISBN:9780134683416
Author:Ron Larson, Betsy Farber
Publisher:PEARSON
The Basic Practice of Statistics
Statistics
ISBN:9781319042578
Author:David S. Moore, William I. Notz, Michael A. Fligner
Publisher:W. H. Freeman
Introduction to the Practice of Statistics
Statistics
ISBN:9781319013387
Author:David S. Moore, George P. McCabe, Bruce A. Craig
Publisher:W. H. Freeman