
MATLAB: An Introduction with Applications
6th Edition
ISBN: 9781119256830
Author: Amos Gilat
Publisher: John Wiley & Sons Inc
expand_more
expand_more
format_list_bulleted
Related questions
Question
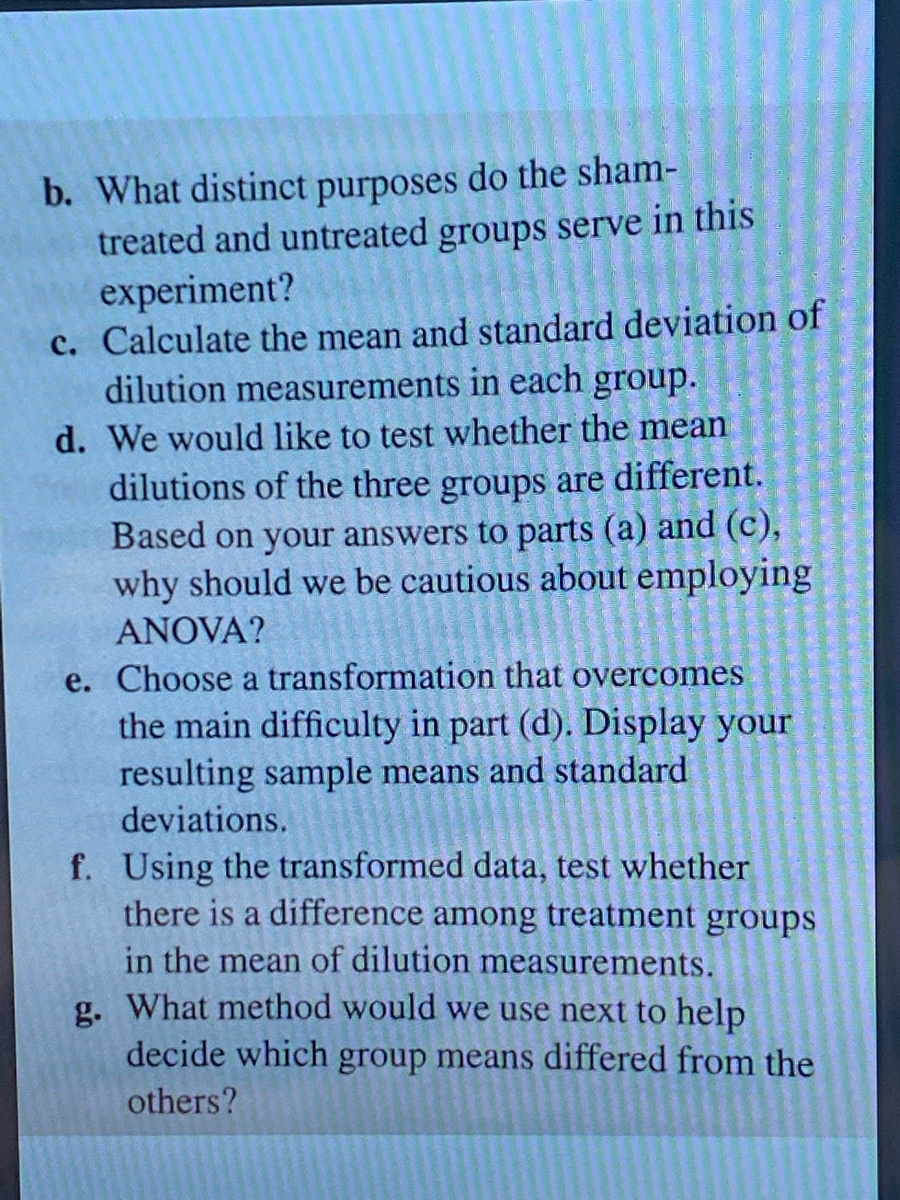

Transcribed Image Text:b. What distinct purposes do the sham-
treated and untreated groups serve in this
experiment?
c. Calculate the mean and standard deviation of
dilution measurements in each group.
d. We would like to test whether the mean
dilutions of the three groups are different.
Based on your answers to parts (a) and (c),
why should we be cautious about employing
ANOVA?
e. Choose a transformation that overcomes
the main difficulty in part (d). Display your
resulting sample means and standard
deviations.
f. Using the transformed data, test whether
there is a difference among treatment groups
in the mean of dilution measurements.
g. What method would we use next to help
decide which group means differed from the
others?

Transcribed Image Text:24. People with an autoimmune disease like lupus
produce antibodies that react to their own
tissues. Research has shown that lupus-prone
strains of mice have B cells with redudd
expression levels of the receptor gene SYRIIB,
suggesting that low expression of this gene
might contribute to the autoimmune reaction. To
test this, McGaha et al. (2005) experimentally
enhanced expression of the FcyRIIB gene in
bone marrow taken from a lupus-prone mouse
strain and transplanted it back into irradiated
mice of the same strain. Other mice of the same
strain were subjected to the same procedures but
received bone marrow that was not enhanced for
FcyRIIB expression (i.e., the sham treatment).
Mice in a third group were left untreated. Auto-
immune reactivity was measured six months
later. The following is a frequency table indi-
cating the highest dilution of blood serum, in
a fixed series of dilutions, at which reactivity
could be detected (a high dilution reflects a high
autoimmune reactivity).
Dilution
measured
100
200
400
800
Total
Number of mice
Sham-
Enhanced treated
0
34209
SNEOO
0
3
2
5
Untreated
a. Is this a balanced design? Explain.
55246
0
0
Expert Solution
This question has been solved!
Explore an expertly crafted, step-by-step solution for a thorough understanding of key concepts.

Step by stepSolved in 2 steps with 2 images

Knowledge Booster

Similar questions
- A group of 30 postmenopausal women were given oral conjugated estrogen for one month.Plasma levels of plasminogen-activator inhibitor type 1 (PAI-1) went down for 22 of the women, but went up for 8 women.15 Use a sign test to test the null hypothesis that oral conjugated estrogen has no effect on PAI-1 level.Use α=0.10 and use a nondirectional alternative.arrow_forwardA study was conducted that investigated the gene ACTN3, which encodes a protein that functions in fast-twitch muscle fibres. People can be classified according to which genotype of this gene they have, RR, RX or XX. The study included a sample of elite sprinters and a sample of endurance athletes. The researchers are investigating whether there is an association between the genotype classification and the type of athlete (sprinters or endurance). What type of hypothesis test would be appropriate for this study? Explain your answer in one or two sentences.arrow_forwardA group of psychologists recently examined the how odor influences emotion between male and female. Three groups of participants (half male, half female) were first subjected to different types of smell (pleasant, neutral, and unpleasant), and then filled out questionnaire of happiness. The data present the pattern of results obtained in the study, higher score indicating a higher level of happiness. Conduct a hypothesis testing with α = .05 to evaluate the main effects and interactions (follow the four-step procedure).(15 points, be careful with the computation) Calculate the effect size (partial η2) for the main effects and the interaction. (2 points) Report your results in APA style (2 points) Odor pleasant neutral unpleasant Male n = 5 n = 5 n = 5 M = 5 M =10 M =15 SS = 10 SS = 10 SS = 10 Female n = 5 n = 5 n = 5 M =10 M =15 M =20 SS = 10 SS = 10 SS =10arrow_forward
- 27. Lower Limb Surgery. The study "Intrathecal Sufentanil ver- sus Fentanyl for Lower Limb Surgeries- A Randomized Controlled Trial" (Journal of Anaesthesiology Clinical Pharmacology, Vol. 27, Issue 1, pp. 67-73) by P. Motiani et al. compares two different agents, intrathecal sufentail and fentanyl, used in enhancing the anesthesiol- ogy of patients receiving major lower limb surgery. One variable com- pared between the two agents was the amount of blood loss during the surgery. Based on the study, we will assume that, using fentanyl, the amount of blood loss during major lower limb surgery is normally distributed with mean 283.3 ml and standard deviation 83.3 ml. Find the percentage of patients whose amount of blood loss during major lower limb surgery using fentanyl is a. less than 304 ml. b. between 221 and 429 ml. c. more than 450 ml.arrow_forwardAccording to a certain government agency for a large country, the proportion of fatal traffic accidents in the country in which the driver had a positive blood alcohol concentration (BAC) is 0.38. Suppose a random sample of 112 traffic fatalities in a certain region results in 52 that involved a positive BAC. Does the sample evidence suggest that the region has a higher proportion of traffic fatalities involving a positive BAC than the country at the α = 0.1 level of significance? Because npo (1-Po) = (Round to one decimal place as needed.) What are the null and alternative hypotheses? 10, the sample size is Ho: versus H₁: (Type integers or decimals. Do not round.) Find the test statistic, Zo. Find the P-value. P-value = Zo (Round to two decimal places as needed.) = the requirements for testing the hypothesis 5% of the population size, and the sample satisfied. (Round to three decimal places as needed.)arrow_forwardA large randomized trial was conducted to assess the efficacy of Chantix for smoking cessation compared with bupropion (more commonly known as Wellbutrin or Zyban) and a placebo. Chantix is different from most other quit‑smoking products in that it targets nicotine receptors in the brain, attaches to them, and blocks nicotine from reaching them, while bupropion is an antidepressant often used to help people stop smoking. Generally healthy smokers who smoked at least 1010 cigarettes per day were assigned at random to take Chantix ( ?=352n=352 ), bupropion ( ?=329n=329 ), or a placebo ( ?=344n=344 ). The response measure is continuous cessation from smoking for Weeks 99 through 1212 of the study. A two‑way table of the results is given. Treatment Chantix Bupropion Placebo No smoke in weeks 9-12 155 97 61 Smokes in weeks 9-12 197 232…arrow_forward
- A large randomized trial was conducted to assess the efficacy of Chantix for smoking cessation compared with bupropion (more commonly known as Wellbutrin or Zyban) and a placebo. Chantix is different from most other quit-smoking products in that it targets nicotine receptors in the brain, attaches to them, and blocks nicotine from reaching them, while bupropion is an antidepressant often used to help people stop smoking. Generally healthy smokers who smoked at least 10 cigarettes per day were assigned at random to take Chantix (n = 352), bupropion (n 329), or a placebo (n = 344). The response %3| measure is continuous cessation from smoking for Weeks 9 through 12 of the study. A two-way table of the results is given. Treatment Chantix Bupropion Placebo No smoking in Weeks 9-12 155 97 61 Expand Smoked in Weeks 9-12 197 232 283 To access the complete data set, click the link for your preferred software format: Excel Minitab JMP SPSS TI R Mac-TXT PC-TXT CSV CrunchIt! STATE: How does…arrow_forwardThe results of a multicenter clinical trial to determine the safety and efficacy of the pancreatic lipase inhibitor, Xenical, was reported (Ingersoll, 1997). Xenical is used to block the absorption of dietary fat. The article reported that more than 4000 patients in the U.S. and Europe were randomized to receive Xenical or a placebo in a parallel groups study. After one year, 57% of those receiving Xenical had lost at least 5% of their body weight, as opposed to 31% of those receiving a placebo. Assume that exactly 4000 patients were in the study, and that 2000 were randomized to receive a placebo and 2000 received Xenical. Please Compute a 95% confidence interval for the “relative risk” of losing at least 5% of body weight for those receiving Xenical relative to those receiving placebo. Can the drug be considered effective?arrow_forwardSickle-cell anemia is a hereditary chronic blood disease that is extremely severe when an individual carries two copies of the defective gene. It is particularly common in countries plagued by malaria, a parasiticinfection transmitted by mosquitoes. A study in Africa tested 543 children for the sickle-cell gene and also for malaria. In Group 1 which consisted of 136 children with the sickle-cell gene, 36 children had severe malariainfections. Group 2 consisted of 407 children without the sickle-cell gene, and 152 of them had severe malaria infections. Conduct a test to determine if the proportion of severe malaria infections among children withthe sickle-cell trait is different from that among children without. Test at 5% level of significance. Question: What is your p value and t statistic ?arrow_forward
- I have a random sample of data on university students and I want to estimate the following model for first-year student academic performance at university: WAM = β0 + β1faminc + β2ATAR + β3attend + u where WAM = a student's weighted average mark at the end of the first year faminc = a student's family income in $000s ATAR = a student’s university entry score (0-100) attend = the proportion of classes the student attended in their first year I want to estimate the causal effect of class attendance (attend) on WAM. I am concerned there is an omitted variable z that I cannot get data on but I believe it belongs in the model. It is well known that z has a positive effect on WAM and that z is negatively related to class attendance (attend). To answer this question, please assume that ATAR and faminc are both uncorrelated with attend and are both uncorrelated with z. If I estimate the model above without including the variable z, then I can expect that: a) β^3 will be negatively biased…arrow_forward7/8) individuals tend to vary in their taste sensitivity. Is it possible that this trait may be linked to a person’s genetics? A scientist identified the genotype of 30 individuals for a gene she believes to be responsible for taste sensitivity. She compares taste sensitivity across the homozygous dominant, heterozygous, and homozygous recessive individuals. Q) What is the explanatory variable here? Q) What kind of variable is the subject’s genotype?arrow_forwardA number of studies have examined how alcohol consumption affects neuroticism using an animal model. Two kittens are randomly selected from each of 7 litters (two cats from each litter). One cat from each pair is assigned to the experimental group which is subjected to a procedure that induces temporary neurosis. The other cat from each pair is part of the control group (no neurosis induction). All the cats are then offered milk spiked with 5% alcohol. The amount of milk consumed in three minutes is measured (in milliliters). Do the kittens in the experimental group drink more alcohol than the kittens in the control group? What test should you use and why?arrow_forward
arrow_back_ios
arrow_forward_ios
Recommended textbooks for you
- MATLAB: An Introduction with ApplicationsStatisticsISBN:9781119256830Author:Amos GilatPublisher:John Wiley & Sons Inc
 Probability and Statistics for Engineering and th...StatisticsISBN:9781305251809Author:Jay L. DevorePublisher:Cengage Learning
 Statistics for The Behavioral Sciences (MindTap C...StatisticsISBN:9781305504912Author:Frederick J Gravetter, Larry B. WallnauPublisher:Cengage Learning
  Elementary Statistics: Picturing the World (7th E...StatisticsISBN:9780134683416Author:Ron Larson, Betsy FarberPublisher:PEARSON
 The Basic Practice of StatisticsStatisticsISBN:9781319042578Author:David S. Moore, William I. Notz, Michael A. FlignerPublisher:W. H. Freeman
 Introduction to the Practice of StatisticsStatisticsISBN:9781319013387Author:David S. Moore, George P. McCabe, Bruce A. CraigPublisher:W. H. Freeman
MATLAB: An Introduction with Applications
Statistics
ISBN:9781119256830
Author:Amos Gilat
Publisher:John Wiley & Sons Inc
Probability and Statistics for Engineering and th...
Statistics
ISBN:9781305251809
Author:Jay L. Devore
Publisher:Cengage Learning
Statistics for The Behavioral Sciences (MindTap C...
Statistics
ISBN:9781305504912
Author:Frederick J Gravetter, Larry B. Wallnau
Publisher:Cengage Learning
Elementary Statistics: Picturing the World (7th E...
Statistics
ISBN:9780134683416
Author:Ron Larson, Betsy Farber
Publisher:PEARSON
The Basic Practice of Statistics
Statistics
ISBN:9781319042578
Author:David S. Moore, William I. Notz, Michael A. Fligner
Publisher:W. H. Freeman
Introduction to the Practice of Statistics
Statistics
ISBN:9781319013387
Author:David S. Moore, George P. McCabe, Bruce A. Craig
Publisher:W. H. Freeman