23. Calculate the coefficient of concurrent deviation from the following: 60 55 50 56 30 70 40 35 80 80 75 65 40 35 75 63 80 35 20 80 60 60 noo lo borle (B.Com., Osmania Univ., 2012)
23. Calculate the coefficient of concurrent deviation from the following: 60 55 50 56 30 70 40 35 80 80 75 65 40 35 75 63 80 35 20 80 60 60 noo lo borle (B.Com., Osmania Univ., 2012)

Algebra & Trigonometry with Analytic Geometry
13th Edition
ISBN:9781133382119
Author:Swokowski
Publisher:Swokowski
Chapter10: Sequences, Series, And Probability
Section10.8: Probability
Problem 31E

Related questions
Question
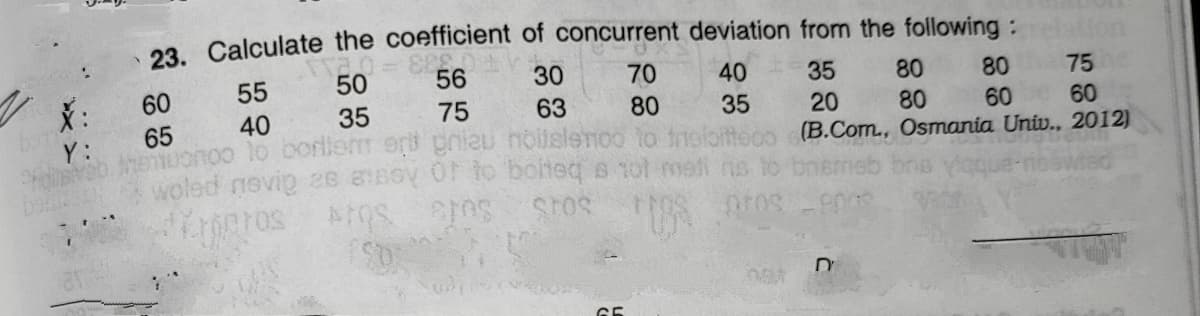
Transcribed Image Text:23 Calculate the coefficient of concurrent deviation from the following:
60
55
50
56
30
70
40
35
80
80
75
40
35
75
63
80
35
20
80
65
t0o to borlik
woled nevig 2s aeoy OF to bolteq s tot
60
60
(B.Com., Osmania Univ., 2012)
Expert Solution
This question has been solved!
Explore an expertly crafted, step-by-step solution for a thorough understanding of key concepts.

Step by step
Solved in 2 steps with 2 images

Recommended textbooks for you
Algebra & Trigonometry with Analytic Geometry
Algebra
ISBN:
9781133382119
Author:
Swokowski
Publisher:
Cengage
Algebra & Trigonometry with Analytic Geometry
Algebra
ISBN:
9781133382119
Author:
Swokowski
Publisher:
Cengage