MATLAB: An Introduction with Applications
6th Edition
ISBN: 9781119256830
Author: Amos Gilat
Publisher: John Wiley & Sons Inc
expand_more
expand_more
format_list_bulleted
Question

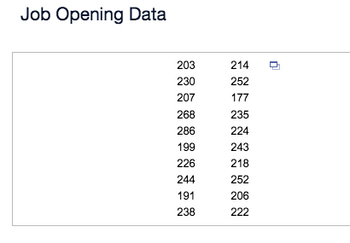
Transcribed Image Text:Job Opening Data
203
230
207
268
286
199
226
244
191
238
214
252
177
235
224
243
218
252
206
222

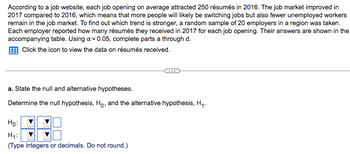
Transcribed Image Text:According to a job website, each job opening on average attracted 250 résumés in 2016. The job market improved in
2017 compared to 2016, which means that more people will likely be switching jobs but also fewer unemployed workers
remain in the job market. To find out which trend is stronger, a random sample of 20 employers in a region was taken.
Each employer reported how many résumés they received in 2017 for each job opening. Their answers are shown in the
accompanying table. Using a = 0.05, complete parts a through d.
Click the icon to view the data on résumés received.
a. State the null and alternative hypotheses.
Determine the null hypothesis, Ho, and the alternative hypothesis, H₁.
Ho:
H₁:
(Type integers or decimals. Do not round.)
Expert Solution
arrow_forward
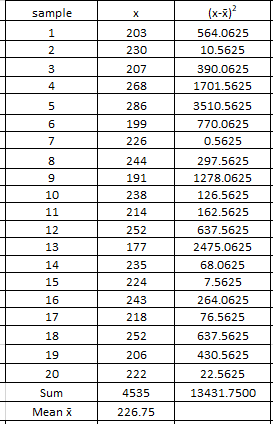
Step 1: Given data :
By applying one sample t-test,

sample size (n) = 20
sample mean (x̄) = Σx/n
= 4535/20
= 226.75
sample standard deviation (s) = √Σ (x-x̄)2 /(n-1)
= √13431.7500/(20-1)
= 26.5882
population mean ( µ ) = 250
Step by stepSolved in 4 steps with 1 images

Knowledge Booster
Similar questions
- The number of semester hours of college credit taken by first-time candidates for a certain professional exam has a Normal distribution with a mean of 120 hours and a standard deviation of 16 hours. Consider a random sample of n first-time candidates for the exam and let x represent the mean number of hours of college credit taken for the sample. Complete parts a through e below. Click the icon to view the table of normal curve areas. ..... a. Describe the shape of the sampling distribution of x. A. The shape is Normal distribution only when sample size is greater than 30 B. The shape is Normal distribution for any sample size O C. is always the same as the distribution of the population D. The shape is skewed right b. If 16 first-time candidates for the exam are randomly selected, what is the probability that the mean number of hours of college credit taken by these students x is between 118 and 122 hours? P(118 < x <122) = (Round to four decimal places as needed.) c. If 64 first-time…arrow_forward1 fo Simplify 1 2 1 2 13 3. 1 @arrow_forwardAt 9:00 A.M. car A is traveling north at 80 miles per hour and is located 80 miles south of car B. Car B is traveling west at 20 miles per hour. (a) Let (0,0) be the initial coordinates of car B in the xy-plane, where units are in miles. Plot the locations of each car at 9:00 A.M. and at 11:00 A.M. (b) Find the distance d between the cars at 11:00 A.M. (a) Plot the position of car B at 9:00 A.M.arrow_forward
- ل | جر 2 ·|· Nwarrow_forward52 - 24 ÷ 3 = ?arrow_forwardThe accompanying table shows the results of a survey in which 250 male and 250 female workers ages 25 to 64 were asked if they contribute to a retirement savings plan at work. Complete parts (a) and (b) below. Click the icon to view the survey results. (a) Find the probability that a randomly selected worker contributes to a retirement savings plan at work, given that the worker is male. The probability that a randomly selected worker contributes to a retirement savings plan at work, given that the worker is male, is (Round to three decimal places as needed.) (b) Find the probability that a randomly selected worker is female, given that the worker contributes to a retirement savings plan at work. The probability that a randomly selected worker is female, given that the worker contributes to a retirement savings plan at work, is (Round to three decimal places as needed.)arrow_forward
arrow_back_ios
arrow_forward_ios
Recommended textbooks for you
 MATLAB: An Introduction with ApplicationsStatisticsISBN:9781119256830Author:Amos GilatPublisher:John Wiley & Sons Inc
 Probability and Statistics for Engineering and th...StatisticsISBN:9781305251809Author:Jay L. DevorePublisher:Cengage Learning
 Statistics for The Behavioral Sciences (MindTap C...StatisticsISBN:9781305504912Author:Frederick J Gravetter, Larry B. WallnauPublisher:Cengage Learning
 Elementary Statistics: Picturing the World (7th E...StatisticsISBN:9780134683416Author:Ron Larson, Betsy FarberPublisher:PEARSON
 The Basic Practice of StatisticsStatisticsISBN:9781319042578Author:David S. Moore, William I. Notz, Michael A. FlignerPublisher:W. H. Freeman
 Introduction to the Practice of StatisticsStatisticsISBN:9781319013387Author:David S. Moore, George P. McCabe, Bruce A. CraigPublisher:W. H. Freeman

MATLAB: An Introduction with Applications
Statistics
ISBN:9781119256830
Author:Amos Gilat
Publisher:John Wiley & Sons Inc

Probability and Statistics for Engineering and th...
Statistics
ISBN:9781305251809
Author:Jay L. Devore
Publisher:Cengage Learning

Statistics for The Behavioral Sciences (MindTap C...
Statistics
ISBN:9781305504912
Author:Frederick J Gravetter, Larry B. Wallnau
Publisher:Cengage Learning

Elementary Statistics: Picturing the World (7th E...
Statistics
ISBN:9780134683416
Author:Ron Larson, Betsy Farber
Publisher:PEARSON

The Basic Practice of Statistics
Statistics
ISBN:9781319042578
Author:David S. Moore, William I. Notz, Michael A. Fligner
Publisher:W. H. Freeman

Introduction to the Practice of Statistics
Statistics
ISBN:9781319013387
Author:David S. Moore, George P. McCabe, Bruce A. Craig
Publisher:W. H. Freeman