
MATLAB: An Introduction with Applications
6th Edition
ISBN: 9781119256830
Author: Amos Gilat
Publisher: John Wiley & Sons Inc
expand_more
expand_more
format_list_bulleted
Related questions
Question
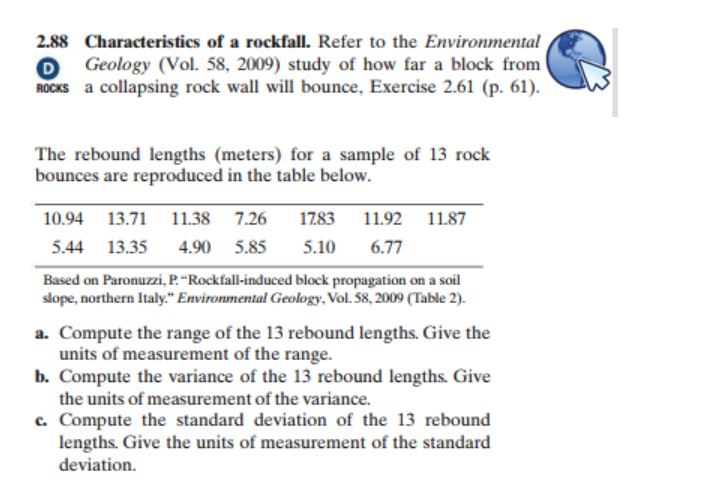

Transcribed Image Text:2.88 Characteristics of a rockfall. Refer to the Environmental
Geology (Vol. 58, 2009) study of how far a block from
ROCKS a collapsing rock wall will bounce, Exercise 2.61 (p. 61).
The rebound lengths (meters) for a sample of 13 rock
bounces are reproduced in the table below.
10.94 13.71 11.38 7.26
1783
11.92
11.87
5.44 13.35
4.90 5.85
5.10
6.77
Based on Paronuzzi, P."Rockfall-induced block propagation on a soil
slope, northern Italy." Environmental Geology, Vol. 58, 2009 (Table 2).
a. Compute the range of the 13 rebound lengths. Give the
units of measurement of the range.
b. Compute the variance of the 13 rebound lengths. Give
the units of measurement of the variance.
c. Compute the standard deviation of the 13 rebound
lengths. Give the units of measurement of the standard
deviation.
Expert Solution
This question has been solved!
Explore an expertly crafted, step-by-step solution for a thorough understanding of key concepts.

This is a popular solution

Trending nowThis is a popular solution!

Step by stepSolved in 2 steps with 2 images

Knowledge Booster

Similar questions
- Gender Alcohol Exercise SQI GPA Male Yes 9 15.5 3.85 Male Yes 11 11.0 5.46 Female No 5 11.1 3.28 Female No 6 13.9 2.37 Female Yes 8 9.9 4.63 Male Yes 11 14.5 4.58 Male Yes 9 10.6 4.96 Male Yes 11 15.1 1.02 Female No 8 12.4 4.33 Female Yes 10 11.5 3.96 Male No 8 10.6 5.83 Male Yes 7 11.5 6.12 Male Yes 10 10.8 2.20 Male Yes 11 12.5 2.93 Male Yes 9 16.4 4.52 Female Yes 2 14.1 4.50 Male Yes 8 15.3 1.63 Female No 6 18.0 3.09 Female No 5 9.7 3.92 Male Yes 11 10.5 3.10 Female No 8 13.7 5.42 Male Yes 8 14.9 2.03 Female No 7 10.9 5.90 Male No 10 14.5 3.25 Male Yes 7 11.5 5.21 Female No 9 11.3 3.31 Male Yes 9 11.6 2.51 Male No 10 15.6 3.88 Male Yes…arrow_forward6:18 ul LTE O MATH 1122 Homework 13.pdf •.. 5 of 6 30 regular and double stuff Oreos were sampled and their filling weighed. Table 1. Example frosting mass data. Filling Masses of Regular Oreos (s) 3.00 2.90 3.20 3.20 3.20 3.12 3.19 3.31 3.39 3.18 3.15 3.15 3.14 3.01 3.01 3.17 3.06 3.16 3.13 3.23 2.94 3.05 3.14 3.30 3.09 3.10 3.11 3.24 3.10 3.15 Filling Masses of Double Stuff Oreos (g) 6.11 6.19 6.27 6.18 6.34 6.21 6.05 6.18 6.34 6.23 6.08 6.04 6.13 6.65 6.20 6.12 6.46 6.37 6.19 6.01 6.21 6.46 6.27 6.25 6.15 6.15 6.35 6.24 6.32 6.03 https://www.amstat.org/ASA/Education/STEW/home.asp The mean of a sample measures the middle of all of the numbers. a) Calculate the mean of each sample. Along with the middle, we would like to measure how spread out the numbers are. The standard deviation measures how spread out the numbers are. A quick and dirty estimation of the standard deviation is one-sixth of the range of the data. That is, get the distance between the min and max and then divide that…arrow_forwardThe following data was reported on total Fe for four types of iron formation (1 = carbonate, 2 = silicate, 3 = magnetite, 4 = hematite). 1: 20.6 28.1 27.8 27.0 27.9 25.2 25.3 27.1 20.5 31.2 2: 26.5 24.0 26.2 20.2 23.6 34.0 17.1 26.8 23.7 24.8 3: 30.2 34.0 27.5 29.4 28.3 26.2 29.9 29.5 30.0 35.8 4: 36.6 44.2 34.1 30.3 32.0 33.1 34.1 32.9 36.3 25.2 Carry out an analysis of variance F test at significance level 0.01. State the appropriate hypotheses. H0: ?1 ≠ ?2 ≠ ?3 ≠ ?4Ha: at least two ?i's are equalH0: ?1 = ?2 = ?3 = ?4Ha: all four ?i's are unequal H0: ?1 ≠ ?2 ≠ ?3 ≠ ?4Ha: all four ?i's are equalH0: ?1 = ?2 = ?3 = ?4Ha: at least two ?i's are unequal Summarize the results in an ANOVA table. (Round your answers two decimal places.) Source df Sum ofSquares MeanSquares f Treatments Error Total Give the test statistic. (Round your answer to two decimal places.)arrow_forward
- EXAMPLE A civil engineer is interested in determining whether four different methods of estimating flood flow frequency pro- duce equivalent estimates of peak discharge when applied to the same watershed. Each procedure is used six times on the watershed, and the resulting discharge data (in cubic feet per second) are shown Estimation Method Observations 1 0.34 0.12 1.23 0.70 1.75 0.12 2 0.91 2.94 2.14 2.36 2.86 4.55 3 6.31 8.37 9.75 6.09 9.82 7.24 4 17.15 11.82 10.95 17.20 14.35 16.82arrow_forwardAn experimental diet to induce weight loss was followed for one week by a randomly selected group of 12 students with the following results. Loss in Pounds Student 1 2 3 5 6 7 8 9 10 11 12 2.5 2.9 0.4 1.7 0.0 1.5 5.5 3.5 3.9 3.5 1.1 2.9 (a) Find a point estimate for the average amount lost after one week on this diet. 2.55 ]x Is this an unbiased estimate of the population mean? Explain. Yes, this an unbiased estimate of the population mean, since E(X) = µ. Yes, this an unbiased estimate of the population mean, since E(X) + μ. O No, this is not an unbiased estimate of the population mean, since E(X) * μ. O No, this is not an unbiased estimate of the population mean, since E(X) = μ. O No, this is not an unbiased estimate of the population mean, since the sample size is too small. (b) Find a point estimate for the variance of the amount lost on this diet. (Round your answer to four decimal places.) 2.3264 x Is this an unbiased estimate of the population variance? Explain. Yes, this an…arrow_forwardConsider the accompanying data on flexural strength (MPa) for concrete beams of a certain type. 8.7 7.2 7.7 6.5 7.8 7.0 11.8 9.7 7.9 8.1 6.3 7.6 7.8 6.0 11.6 7.0 10.7 7.3 6.8 9.0 6.8 7.7 9.7 6.3 8.6 7.4 11.3 (a) Calculate a point estimate of the mean value of strength for the conceptual population of all beams manufactured in this fashion. [Hint: Ex; = 220.3.] (Round your answer to three decimal places.) MPа State which estimator you used. O s/x (b) Calculate a point estimate of the strength value that separates the weakest 50% of all such beams from the strongest 50%. MPа State which estimator you used. O s/X (c) Calculate a point estimate of the population standard deviation o. [Hint: Ex;² = 1868.85.] (Round your answer to three decimal places.) MPа Interpret this point estimate. This estimate describes the spread of the data. This estimate describes the bias of the data. This estimate describes the center of the data. This estimate describes the linearity of the data.arrow_forward
- SECTION 5.4 13. Normal cattle The Virginia Cooperative Extension reports that the mean weight of yearling Angus steers is 1152 pounds. Sup- pose that weights of all such animals can be described by a Normal model with a standard deviation of 84 pounds. What percent of steers weigh a) over 1250 pounds? b) under 1200 pounds? c) between 1000 and 1100 pounds?arrow_forwardQ9: A certain manufacturing process requires that a small hole be drilled into the centre of a metal plate. To regulate that the size of the hole is adequate, samples are taken daily, and the diameters of these holes are measured in mm. The data below is the diameters of the holes drilled in 1st week of January 2022. 3.9 2.53 2.46 2.52 Calculate: (i) Mean (ii) Medium 2.45 (iii) Mode (iv) Standard deviation to three significant figures. (v) Interpret the data shown on frequency bar chart or Histogram 2.53 2.57 2.52arrow_forwardConsider the accompanying data on flexural strength (MPa) for concrete beams of a certain type. 5.5 7.2 7.3 6.3 8.1 6.8 7.0 7.1 6.8 6.5 7.0 6.3 7.9 9.0 8.9 8.7 7.8 9.7 7.4 7.7 9.7 7.9 7.7 11.6 11.3 11.8 10.7 The data below give accompanying strength observations for cylinders. 6.5 5.8 7.8 7.1 7.2 9.2 6.6 8.3 7.0 8.4 7.1 8.1 7.4 8.5 8.9 9.8 9.7 14.1 12.6 11.5 Prior to obtaining data, denote the beam strengths by X,, . Xm and the cylinder strengths by Y,, . Y. Suppose that the X,'s constitute a random sample from a distribution with mean u, and standard deviation o, and that the Y's form a random sample (independent of the X's) from another distribution with mean H2 and standard deviation (a) Use rules of expected value to show that X – Y is an unbiased estimator of µ, - µ. E(X – Y) E(X) – E(Y) = H1 - H2 nm E(X - Y) (E) – E(Y)* = l1 - 42 E(X - Y) = nm( E(X) – E(Yn) = H1 - H2 E(X – Y) E(X - Y) = V E(X) – E(Y) = µ1 – H2 E(X) – E(Y) = µ1 - 42 Calculate the estimate for the given data.…arrow_forward
- .2.35-1 Assigned Media lestion Heip The lengths of time (in years) it took a random sample of 32 former smokers to quit smoking permanently are listed. Assume the population standard deviation is 6.7 years. At a = 0.08, is there enough evidence to reject the claim that the mean time it takes smokers to quit smoking permanently is 14 years? Complete parts (a) through (e). 20.1 15.9 13.5 18.2 20.8 10.4 19.5 21.7 O 13.9 10.9 13.9 13.5 17.5 13.6 16.2 14.5 19.8 12.6 7.1 16.2 21.1 8.3 12.3 21.3 9.5 8.4 16.5 16.9 13.9 21.9 18.3 14.3 (a) Identify the claim and state the null hypothesis and alternative hypothesis. OC. Ho: H# 14 (claim) Ha:H= 14 O A. Ho: H> 14 (claim) B. Ho: H2 14 (claim) Hai HS 14 HaiH 14 O F. Ho: HS 14 (claim) %3D Ha: H#14 Ha: HS 14 (claim) Ha: H> 14 Click to select your answer and then click Check Answer. ? 3 parts remaining Clear All Check Answer e Type here to search O PrtScn End Home F8 PgUp F10 F1 F2 F3 F4 F5 F6 F7 F9 $4 1 3. 4. 7 8 9-arrow_forward9.17arrow_forwardLImmersive Reader O Open 4 1 ent 4. The table below shows the pH values of ripemangoes. A. Construct the frequency distribution table (FDT) using CN = 3. B. find the mean, median and mode ly 3.0 3.3 3.4 3.5 3.6 3.0 3.3 3.4 3.5 3.6 od elds 3.1 3.3 3.4 3.5 3.6 fic erof 3.1 3.3 3.4 3.5 3.7 d che andarrow_forward
arrow_back_ios
arrow_forward_ios
Recommended textbooks for you
- MATLAB: An Introduction with ApplicationsStatisticsISBN:9781119256830Author:Amos GilatPublisher:John Wiley & Sons Inc
 Probability and Statistics for Engineering and th...StatisticsISBN:9781305251809Author:Jay L. DevorePublisher:Cengage Learning
 Statistics for The Behavioral Sciences (MindTap C...StatisticsISBN:9781305504912Author:Frederick J Gravetter, Larry B. WallnauPublisher:Cengage Learning
  Elementary Statistics: Picturing the World (7th E...StatisticsISBN:9780134683416Author:Ron Larson, Betsy FarberPublisher:PEARSON
 The Basic Practice of StatisticsStatisticsISBN:9781319042578Author:David S. Moore, William I. Notz, Michael A. FlignerPublisher:W. H. Freeman
 Introduction to the Practice of StatisticsStatisticsISBN:9781319013387Author:David S. Moore, George P. McCabe, Bruce A. CraigPublisher:W. H. Freeman
MATLAB: An Introduction with Applications
Statistics
ISBN:9781119256830
Author:Amos Gilat
Publisher:John Wiley & Sons Inc
Probability and Statistics for Engineering and th...
Statistics
ISBN:9781305251809
Author:Jay L. Devore
Publisher:Cengage Learning
Statistics for The Behavioral Sciences (MindTap C...
Statistics
ISBN:9781305504912
Author:Frederick J Gravetter, Larry B. Wallnau
Publisher:Cengage Learning
Elementary Statistics: Picturing the World (7th E...
Statistics
ISBN:9780134683416
Author:Ron Larson, Betsy Farber
Publisher:PEARSON
The Basic Practice of Statistics
Statistics
ISBN:9781319042578
Author:David S. Moore, William I. Notz, Michael A. Fligner
Publisher:W. H. Freeman
Introduction to the Practice of Statistics
Statistics
ISBN:9781319013387
Author:David S. Moore, George P. McCabe, Bruce A. Craig
Publisher:W. H. Freeman