
Related questions
Concept explainers
Can you solve this one for me, and add all the calculation steps and interpretation. I also attached the related picture to this question. Thanks
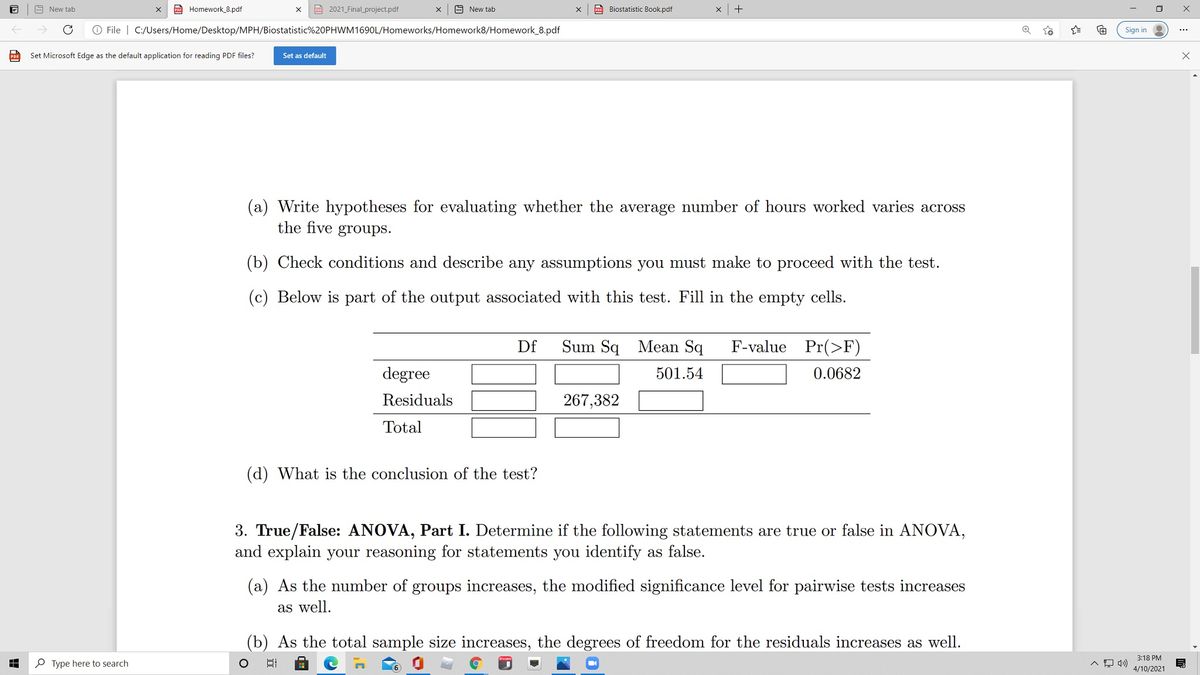
2. Work hours and education. The General Social Survey collects data on demographics, education,
and work, among many other characteristics of US residents. Using ANOVA, we can consider
educational attainment levels for all 1,172 respondents at once. Below are the distributions of
hours worked by educational attainment and relevant summary statistics that will be helpful in
carrying out this analysis.
(a) Write hypotheses for evaluating whether the average number of hours worked varies across
the five groups.
(b) Check conditions and describe any assumptions you must make to proceed with the test.
(c) Below is part of the output associated with this test. Fill in the empty cells.
Df Sum Sq
degree XXXXX XXXXX 501.54 XXXXX 0.0682
Residuals XXXXX 267,382 XXXXX
Total XXXXX XXXXX
(d) What is the conclusion of the test?


Trending nowThis is a popular solution!

Step by stepSolved in 2 steps


- Do the concepts of class limits, marks, cutpoints, and midpoints make sense for qualitative data? Explain your answerarrow_forwardIn what situations would you see a large difference between the mean and median of a data set? Give specific situations where that may be the case, and explain your reasoning.arrow_forwardIf the median of a data set is 760, the upper quartile is 950, and the lower quartile is 650, what is the interquartile range?arrow_forward
- I need help how to find the mean, median, mode, midrange Thank you.arrow_forwardExplain the relation between a population and a sample. What characteristics should a sample have to be representative of the population?arrow_forwardConstruct a box plot of a data set with a median of 50, a minimum value of 20, first quartile 42, IQR=29, and a maximum value of 90. What percentage of total data is between 42 and 71?arrow_forward
- MATLAB: An Introduction with ApplicationsStatisticsISBN:9781119256830Author:Amos GilatPublisher:John Wiley & Sons Inc
 Probability and Statistics for Engineering and th...StatisticsISBN:9781305251809Author:Jay L. DevorePublisher:Cengage Learning
 Statistics for The Behavioral Sciences (MindTap C...StatisticsISBN:9781305504912Author:Frederick J Gravetter, Larry B. WallnauPublisher:Cengage Learning
  Elementary Statistics: Picturing the World (7th E...StatisticsISBN:9780134683416Author:Ron Larson, Betsy FarberPublisher:PEARSON
 The Basic Practice of StatisticsStatisticsISBN:9781319042578Author:David S. Moore, William I. Notz, Michael A. FlignerPublisher:W. H. Freeman
 Introduction to the Practice of StatisticsStatisticsISBN:9781319013387Author:David S. Moore, George P. McCabe, Bruce A. CraigPublisher:W. H. Freeman