
MATLAB: An Introduction with Applications
6th Edition
ISBN: 9781119256830
Author: Amos Gilat
Publisher: John Wiley & Sons Inc
expand_more
expand_more
format_list_bulleted
Related questions
Question

Transcribed Image Text:Time to file
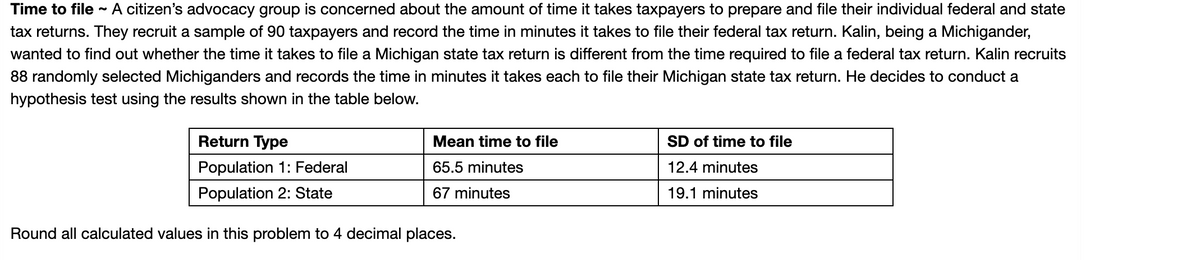
A citizen's advocacy group is concerned about the amount of time it takes taxpayers to prepare and file their individual federal and state
tax returns. They recruit a sample of 90 taxpayers and record the time in minutes it takes to file their federal tax return. Kalin, being a Michigander,
wanted to find out whether the time it takes to file a Michigan state tax return is different from the time required to file a federal tax return. Kalin recruits
88 randomly selected Michiganders and records the time in minutes it takes each to file their Michigan state tax return. He decides to conduct a
hypothesis test using the results shown in the table below.
Return Type
Mean time to file
SD of time to file
Population 1: Federal
65.5 minutes
12.4 minutes
Population 2: State
67 minutes
19.1 minutes
Round all calculated values in this problem to 4 decimal places.

Transcribed Image Text:2. Which conditions must hold for inferential procedures to be valid for this scenario? Select all that apply.
A. The histogram of the residuals must be normally distributed.
|B. The expected count for each level of the categorical variable must be at least 5.
C. The observations within each sample must be independent.
D. The two sample groups must be independent of each other.
E. The data distribution for both federal and state tax filing times must be normally distributed or each sample size must be larger than 30.
3. Calculate the appropriate test statistic.
?
V =
4. Calculate the p-value using 148.782582 degrees of freedom.
p-value =
5. Which of the following is a correct interpretation of the p-value?
OA. The p-value is the probability that the mean tax filing times for Federal and Michigan tax returns are equal.
B. The p-value is the approximate proportion of time we would see a difference as extreme as our observed difference or something more
extreme in repeated sampling under the null model.
C. The p-value is the power of a hypothesis test if the alternate hypothesis is true.
D. In repeated sampling, we have little evidence that the null hypothesis is a good fit for our observed difference.
6. Use the data to construct a 99% confidence interval for the true difference, uj - µ2:
).
Expert Solution
This question has been solved!
Explore an expertly crafted, step-by-step solution for a thorough understanding of key concepts.

This is a popular solution

Trending nowThis is a popular solution!

Step by stepSolved in 6 steps

Knowledge Booster

Similar questions
- 1. Consider a sample with data values of 2.20; 1.98; 1.95; 2.27; 2.25; 2,24; 2.31 Compute the mean.arrow_forwardLightning Deaths Refer to the sample data in Cumulative Review Exercise 1. a. What is the level of measurement of the data (nominal, ordinal, interval, ratio)? b. Are the values discrete or continuous? c. Are the data categorical or quantitative? d. Is the sample a simple random sample?arrow_forward. Myers-Briggs: Actors Isabel Briggs Myers was a pioneer in the study of personality types. The following information is taken from MBTI Manual: A Guide to the Development and Use of the Myers-Briggs Type Indicator by Myers and McCaulley (Consulting Psychologists Press). In a random sample of 62 professional actors, it was found that 39 were extroverts. Let p represent the proportion of all actors who are extroverts. Find a point estimate for p. Find a 95% confidence interval for p. Give a brief interpretation of the meaning of the confidence interval you have found. Check Requirements Do you think the conditions np > 5 and nq > 5 are satisfied in this problem? Explain why this would be an important consideration.arrow_forward
- Which of these scenarios means that a pretest-posttest design with a non-equivalent control group is not suitable? Select all that apply. O a. All of the available participants will be receiving the intervention at the same time. O b. Authors want to examine for any trends in the data over time. O c. The participants were placed into the experimental and control groups by natural circumstances rather than random assignment. O d. Authors want to compare averages between two groups before and after the intervention using an ANOVA.arrow_forwardRefer to the data set in the accompanying table. Assume that the paired sample data is a simple random sample and the differences have a distribution that is approximately normal. Use a significance level of 0.10 to test for a difference between the weights of discarded paper (in pounds) and weights of discarded plastic (in pounds). a. Identify the test statistic. t equals (Round to two decimal places as needed.) b. Identify the P-value. P-value equals (Round to three decimal places as needed.)arrow_forwardConsider a sample with data values of 57,45,50,39,50,59,60, and 48. Compute the following values a. Mode b. 40th percentile c. Variance d. Standard deviation e. Coefficient of variationarrow_forward
arrow_back_ios
arrow_forward_ios
Recommended textbooks for you
- MATLAB: An Introduction with ApplicationsStatisticsISBN:9781119256830Author:Amos GilatPublisher:John Wiley & Sons Inc
 Probability and Statistics for Engineering and th...StatisticsISBN:9781305251809Author:Jay L. DevorePublisher:Cengage Learning
 Statistics for The Behavioral Sciences (MindTap C...StatisticsISBN:9781305504912Author:Frederick J Gravetter, Larry B. WallnauPublisher:Cengage Learning
  Elementary Statistics: Picturing the World (7th E...StatisticsISBN:9780134683416Author:Ron Larson, Betsy FarberPublisher:PEARSON
 The Basic Practice of StatisticsStatisticsISBN:9781319042578Author:David S. Moore, William I. Notz, Michael A. FlignerPublisher:W. H. Freeman
 Introduction to the Practice of StatisticsStatisticsISBN:9781319013387Author:David S. Moore, George P. McCabe, Bruce A. CraigPublisher:W. H. Freeman
MATLAB: An Introduction with Applications
Statistics
ISBN:9781119256830
Author:Amos Gilat
Publisher:John Wiley & Sons Inc
Probability and Statistics for Engineering and th...
Statistics
ISBN:9781305251809
Author:Jay L. Devore
Publisher:Cengage Learning
Statistics for The Behavioral Sciences (MindTap C...
Statistics
ISBN:9781305504912
Author:Frederick J Gravetter, Larry B. Wallnau
Publisher:Cengage Learning
Elementary Statistics: Picturing the World (7th E...
Statistics
ISBN:9780134683416
Author:Ron Larson, Betsy Farber
Publisher:PEARSON
The Basic Practice of Statistics
Statistics
ISBN:9781319042578
Author:David S. Moore, William I. Notz, Michael A. Fligner
Publisher:W. H. Freeman
Introduction to the Practice of Statistics
Statistics
ISBN:9781319013387
Author:David S. Moore, George P. McCabe, Bruce A. Craig
Publisher:W. H. Freeman