
FINANCIAL ACCOUNTING
10th Edition
ISBN: 9781259964947
Author: Libby
Publisher: MCG
expand_more
expand_more
format_list_bulleted
Related questions
Question

Transcribed Image Text:01
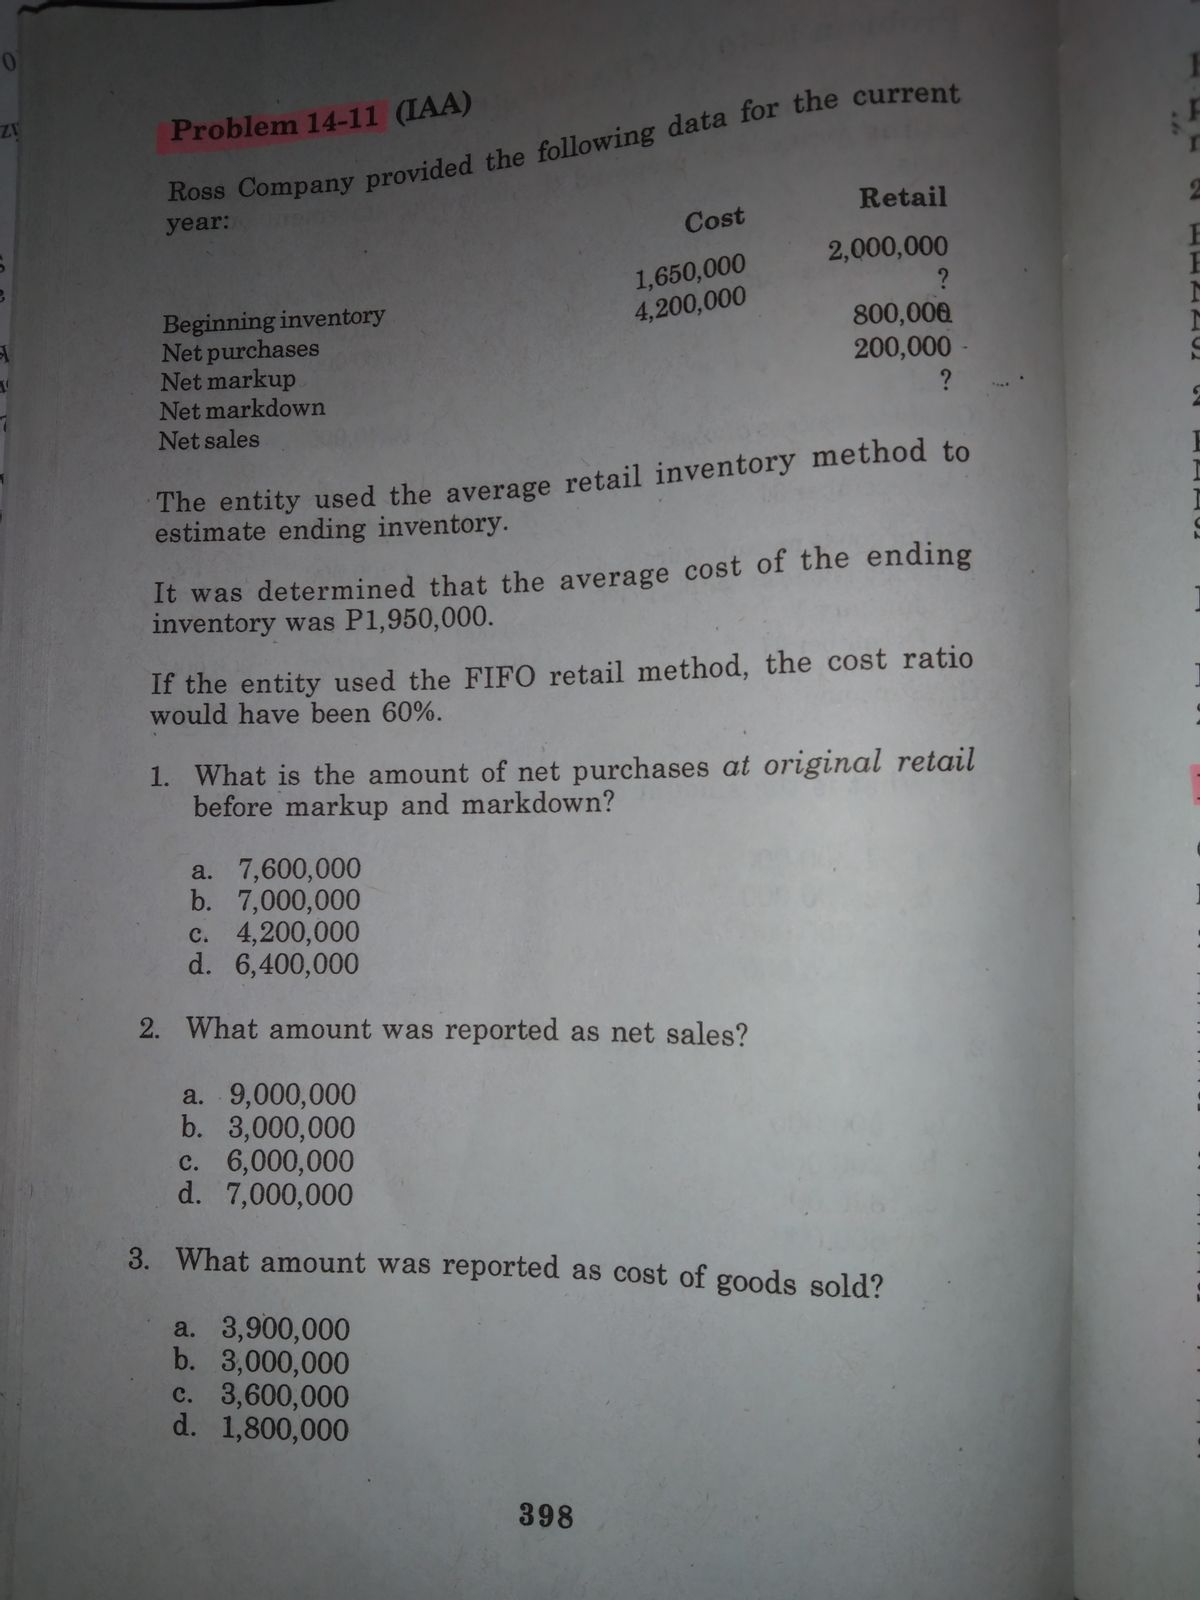
Ross Company provided the following data for the current.
year:
Problem 14-11 (IAA)
Retail
Cost
1,650,000
4,200,000
2,000,000
6N
Beginning inventory
Net purchases
Net markup
Net markdown
800,000
200,000 -
Net sales
The entity used the average retail inventory method to
estimate ending inventory.
It was determined that the average cost of the ending
inventory was P1,950,000.
If the entity used the FIF0 retail method, the cost ratio
would have been 60%.
1. What is the amount of net purchases at original retail
before markup and markdown?
a. 7,600,000
b. 7,000,000
с. 4,200,000
d. 6,400,000
2. What amount was reported as net sales?
a. 9,000,000
b. 3,000,000
c. 6,000,000
d. 7,000,000
3. What amount was reported as cost of goods sold?
a. 3,900,000
b. 3,000,000
c. 3,600,000
d. 1,800,000
398
E HA C
Expert Solution
This question has been solved!
Explore an expertly crafted, step-by-step solution for a thorough understanding of key concepts.

This is a popular solution

Trending nowThis is a popular solution!

Step by stepSolved in 2 steps with 2 images

Knowledge Booster


Learn more about
Need a deep-dive on the concept behind this application? Look no further. Learn more about this topic, accounting and related others by exploring similar questions and additional content below.Similar questions
- A B C D E Sales revenue $40,400 $75,400 $573,700 $34,800 $54,100 Cost of goods sold 19,200 50,500 273,600 19,400 30,500 Operating expenses 9,800 39,800 230,700 11,800 17,900 Total expenses 29,000 90,300 504,300 31,200 48,400 Operating profit (loss) $11,400 $(14,900) $69,400 $3,600 $5,700 Identifiable assets $34,500 $80,000 $501,100 $64,700 $50,400 Sales of segments B and C included intersegment sales of $20,000 and $101,000, respectively. (a) Determine which of the segments are reportable based on the: 1. Revenue test. 2 Operating profit (loss) test. 3. Identifiable assets test. Reportable Segmentarrow_forwardFor 20Y2, Macklin Inc. reported a significant increase in net income. At the end of the year, Chris Jenkins, the president, is presented with the following condensed comparative income statement: Macklin Inc. Comparative Income Statement For the Years Ended December 31, 20Y2 and 20Y1 20Y2 $910,000 441,000 $469,000 $139,150 99,450 $238,600 $230,400 65,000 $295,400 65,000 $230,400 Sales Cost of goods sold Gross profit Selling expenses Administrative expenses Total operating expenses Income from operations Other revenue Income before income tax Income tax expense Net income 20Y1 $700,000 350,000 $350,000 $115,000 85,000 $200,000 $150,000 50,000 $200,000 50,000 $150,000 Required: Prepare a comparative income statement with horizontal analysis for the two-year period, using 20Y1 as the base year. Round percentages to one decimal place. Use the minus sign to indicate a decrease in the "Difference".columns.arrow_forwardThe lable shows some of the hems in an economy's National Income and Product Accounts Calculate net domestic product at factor cost using the income approach What is the statistical discrepancy? Arseto 1 decimal place Amount Wage Government exper Interest, rent, and pra Consumption expend 6.0 2.0 24 74 1.6 00 Indirect as less subsidies 07 Retired prof 16 1.3 1.1 10.5 1.3 Using the income approach, nel domestic product al factor con The statistical discrepancy is Transf Personal Income GNP Depreciationarrow_forward
- Financial information is presented below: Operating expenses $ 33000 Sales revenue 211000 Cost of goods sold 129000 Gross profit would be $178000. $ 82000. $ 33000. $ 49000.arrow_forward5arrow_forwardFinancial information is presented below: Operating Expenses $56000 Sales Revenue Cost of Goods Sold Gross profit would be $48000. $238000. $182000. $104000. 238000 134000arrow_forward
arrow_back_ios
arrow_forward_ios
Recommended textbooks for you
 AccountingAccountingISBN:9781337272094Author:WARREN, Carl S., Reeve, James M., Duchac, Jonathan E.Publisher:Cengage Learning,
 Accounting Information SystemsAccountingISBN:9781337619202Author:Hall, James A.Publisher:Cengage Learning,
 Horngren's Cost Accounting: A Managerial Emphasis...AccountingISBN:9780134475585Author:Srikant M. Datar, Madhav V. RajanPublisher:PEARSON
 Intermediate AccountingAccountingISBN:9781259722660Author:J. David Spiceland, Mark W. Nelson, Wayne M ThomasPublisher:McGraw-Hill Education
 Financial and Managerial AccountingAccountingISBN:9781259726705Author:John J Wild, Ken W. Shaw, Barbara Chiappetta Fundamental Accounting PrinciplesPublisher:McGraw-Hill Education
Accounting
Accounting
ISBN:9781337272094
Author:WARREN, Carl S., Reeve, James M., Duchac, Jonathan E.
Publisher:Cengage Learning,
Accounting Information Systems
Accounting
ISBN:9781337619202
Author:Hall, James A.
Publisher:Cengage Learning,
Horngren's Cost Accounting: A Managerial Emphasis...
Accounting
ISBN:9780134475585
Author:Srikant M. Datar, Madhav V. Rajan
Publisher:PEARSON
Intermediate Accounting
Accounting
ISBN:9781259722660
Author:J. David Spiceland, Mark W. Nelson, Wayne M Thomas
Publisher:McGraw-Hill Education
Financial and Managerial Accounting
Accounting
ISBN:9781259726705
Author:John J Wild, Ken W. Shaw, Barbara Chiappetta Fundamental Accounting Principles
Publisher:McGraw-Hill Education