
Related questions
Concept explainers
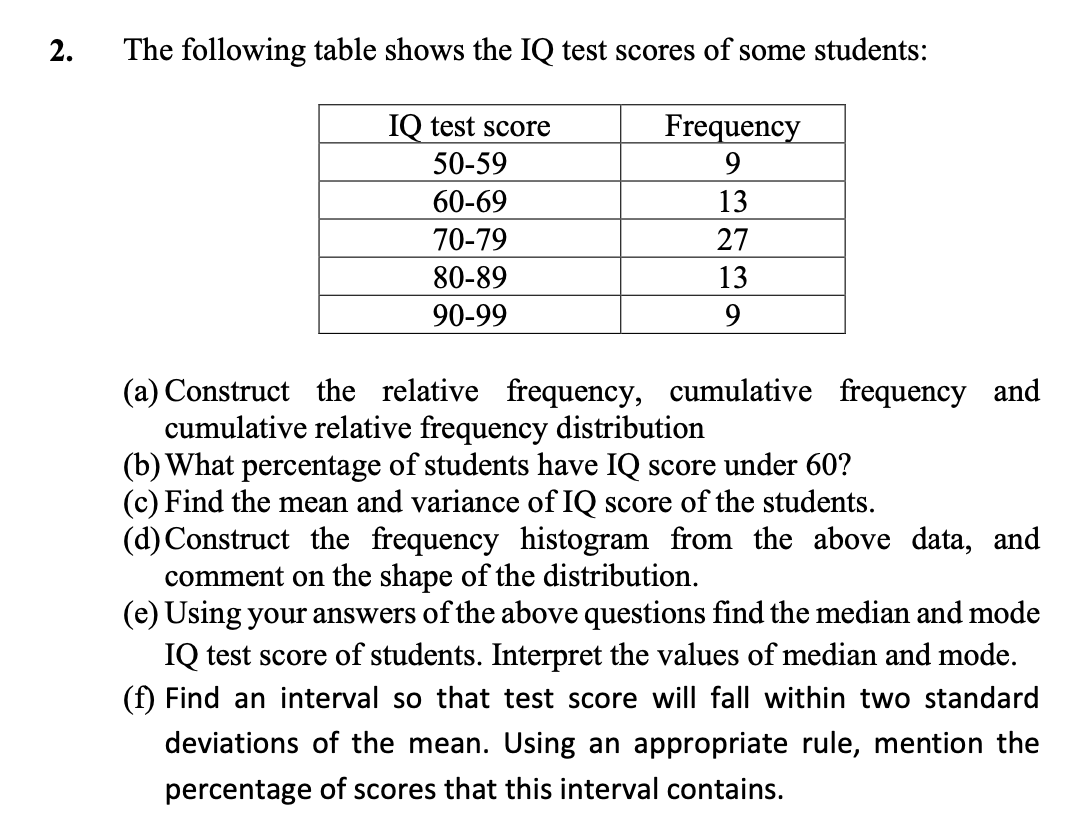
The following table shows the IQ test scores of some students:
IQ test score 50-59 60-69 70-79 80-89 90-99
Frequency 9 13 27 13 9
(a)Construct the relative frequency, cumulative frequency and cumulative relative frequency distribution
(b) What percentage of students have IQ score under 60?
(c) Find the mean and variance of IQ score of the students. (d)Construct the frequency histogram from the above data, and
comment on the shape of the distribution.
-
(e) Using your answers of the above questions find the median and mode
IQ test score of students. Interpret the values of median and mode.
-
(f) Find an interval so that test score will fall within two standard deviations of the mean. Using an appropriate rule, mention the
percentage of scores that this interval contains.


Trending nowThis is a popular solution!

Step by stepSolved in 3 steps


- How was the following relative frequency answers on the bottom left corner found from the data table on the upper right corner?arrow_forwardA psychologist has designed an index to measure the social perspectives of elementary school children. The index is based on ratings of a child’s responses to questions about a set of photographs showing different social situations. The following are the indices measured on a random sample of 16 children attending elementary school in a particular district. 48, 75, 69, 58, 60, 68, 59, 66, 71, 52, 49, 60, 54, 55, 70, 57 For the data the mean index is 60.69 and the standard deviation is 8.26. The confidence interval is 95%, with a level of significance of 0.05. Perform a statistical test to determine if the population mean index is greater than 50. a) Name of hypothesis test: b) H0: c) HA: d) Test Statistic: e) Rejection region: f) Decision in the context of the problem:arrow_forwardThe durations (minutes) of 26 electric power outages in the community of Sonando Heights over the past five years are shown below. 38 48 22 69 24 15 53 14 48 1 13 42 42 99 30 18 12 53 19 2 17 26 93 25 16 20 Click here for the Excel Data File (a) Find the mean, median, and mode. (Round your answers to 2 decimal places.) Descriptive Statistics Data Mean Median Mode (b) Are the mean and median about the same? (Click to select) Yes No , the mean is (Click to select) greater than less than the median. (c) Is the mode a good measure of center for this data set? Yes No (d) Is the distribution skewed? Yes, the distribution is skewed left. No, the distribution is symmetric. Yes, the distribution is skewed right.arrow_forward
- How is a frequency distribution chart incorrectly constructed?arrow_forwardComplete the following frequency chart.A frequency chart of temperatures Temperature Frequency Relative Frequency 70 - 74 75 - 79 80 - 84 85 - 89 90 - 94 From the frequency chart, calculate the mean. How does the mean from the raw data (question 7) compare to the mean from the grouped data (question 9)? Use the frequency chart to create a histogram of the daily high temperatures at Cox-Dayton International Airport for June and July 2018. Describe the distribution by shape, center, and spread. Also, state whether there are any outliers.arrow_forwardCalculation of a mean is most appropriate for which of the following sets of data? Attitudes of graduate nurses toward the elderly measured by axillary temperature Ranking of nursing students by clinical instructors according to perceived technical ability. Percent of nurses in each specialty area.arrow_forward
- Advanced Engineering MathematicsAdvanced MathISBN:9780470458365Author:Erwin KreyszigPublisher:Wiley, John & Sons, Incorporated
 Numerical Methods for EngineersAdvanced MathISBN:9780073397924Author:Steven C. Chapra Dr., Raymond P. CanalePublisher:McGraw-Hill Education
 Introductory Mathematics for Engineering Applicat...Advanced MathISBN:9781118141809Author:Nathan KlingbeilPublisher:WILEY
  Mathematics For Machine TechnologyAdvanced MathISBN:9781337798310Author:Peterson, John.Publisher:Cengage Learning,
